
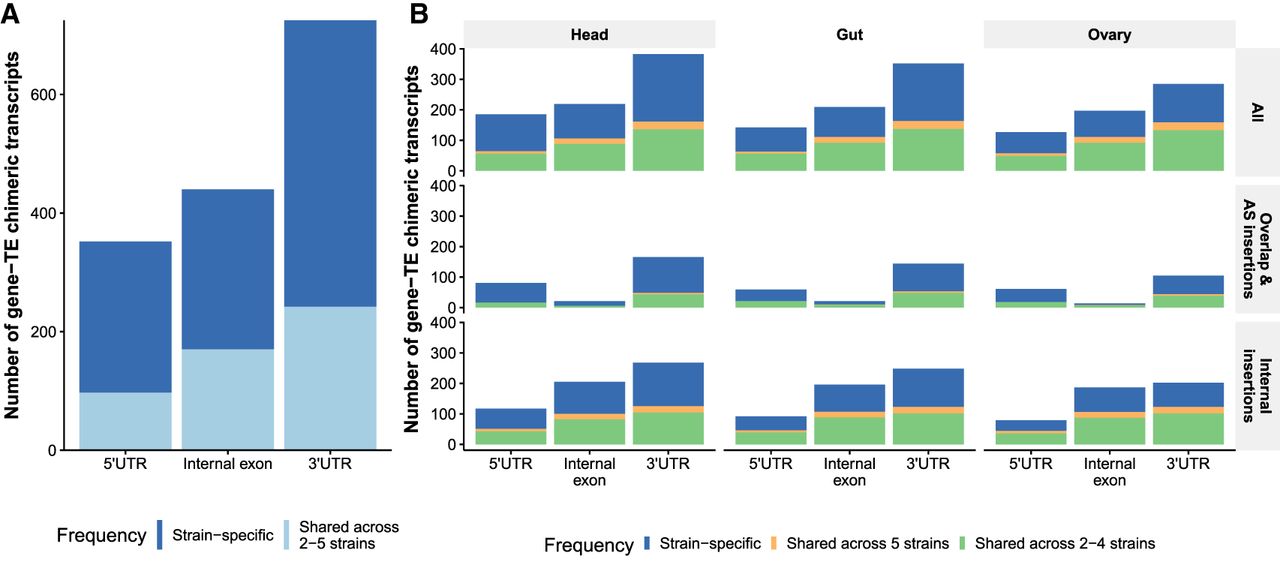
Figure 3.
Position and frequency distribution of TEs in chimeric transcripts. (A) Number of gene–TE chimeric transcripts by position and frequency. (B) Number of chimeric gene–TE transcripts by insertion group and body part, according to the insertion position (5′/3′ UTRs or internal exons) and frequency. Each dot represents the number of chimeric gene–TE transcripts according to the frequency: strain-specific (blue), shared across two to four strains (green), and shared across all five strains (orange). These analyses were performed with the subset of chimeric transcripts with only one TE annotated (1634).


