
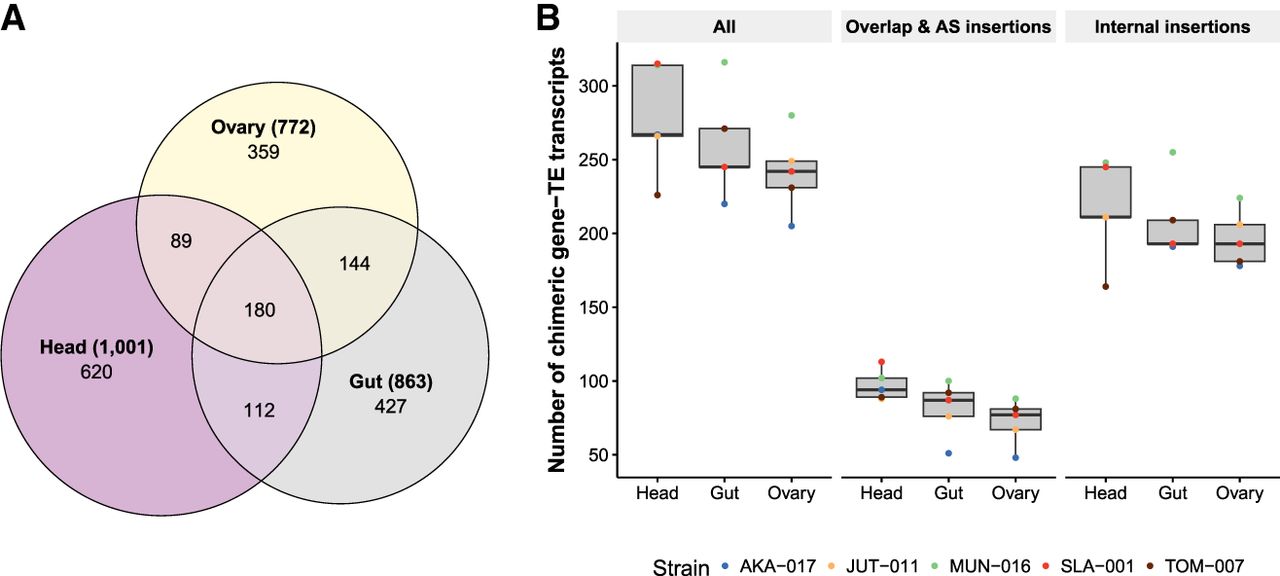
Figure 2.
Distribution of chimeric transcripts across body parts and insertion groups. (A) Venn diagram showing the overall number of chimeric transcripts shared across body parts in the five strains. (B) Number of chimeric gene–TE transcripts detected by body part, strain, and insertion group. (All) All chimeric transcripts detected in all body parts and strains.


