
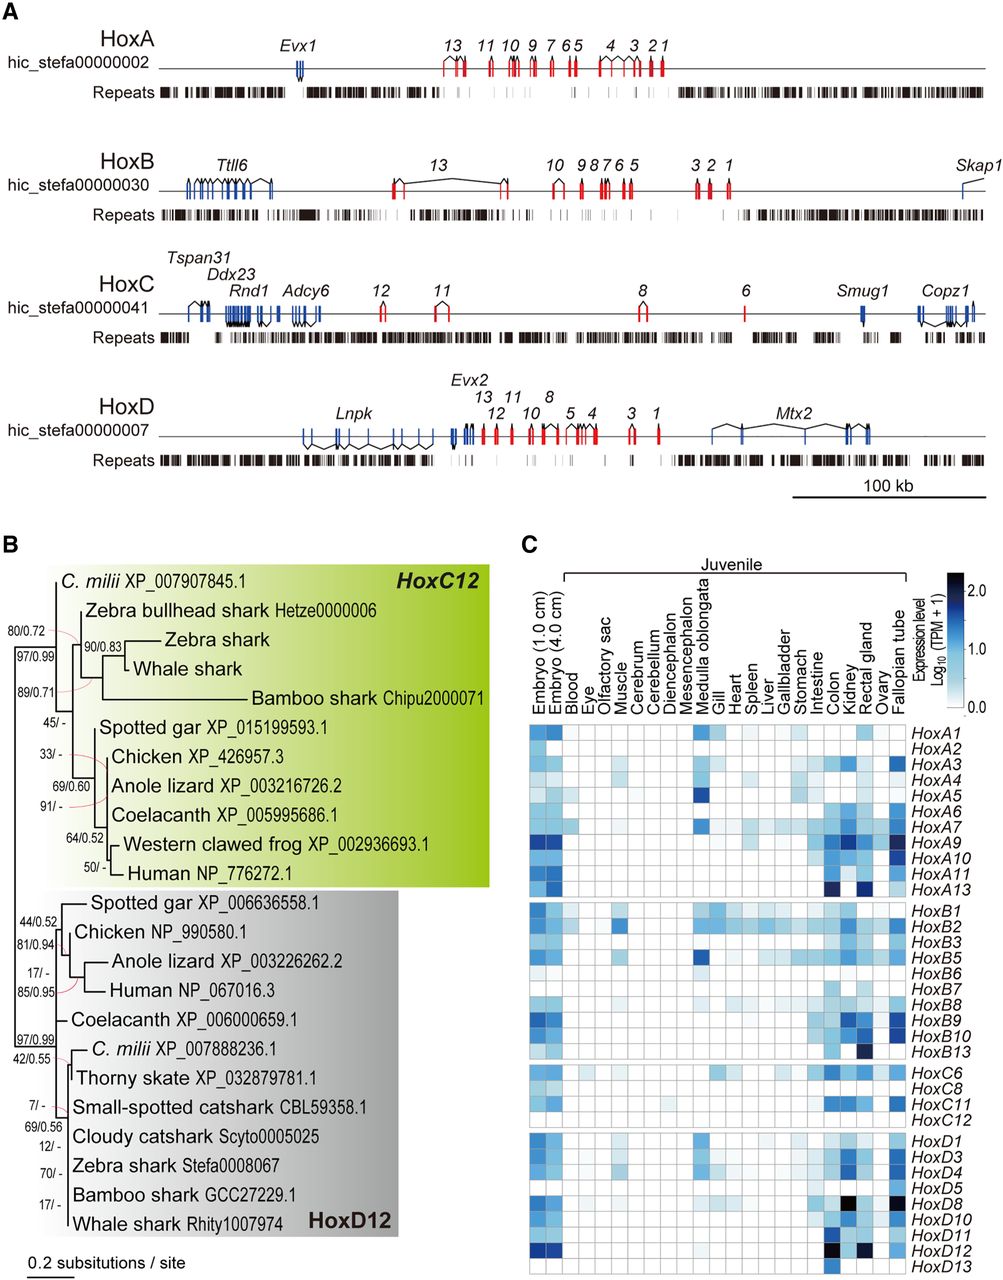
Figure 6.
Zebra shark Hox C genes. (A) Genomic structure of the zebra shark Hox clusters and their neighboring regions. The exons of the Hox genes are shown in red boxes. (B) Molecular phylogenetic tree of Hox12 group of genes. The tree was inferred with the maximum-likelihood method as described in Methods. (C) Expression profiles of the zebra shark Hox genes in embryos and various tissues of a juvenile.


