
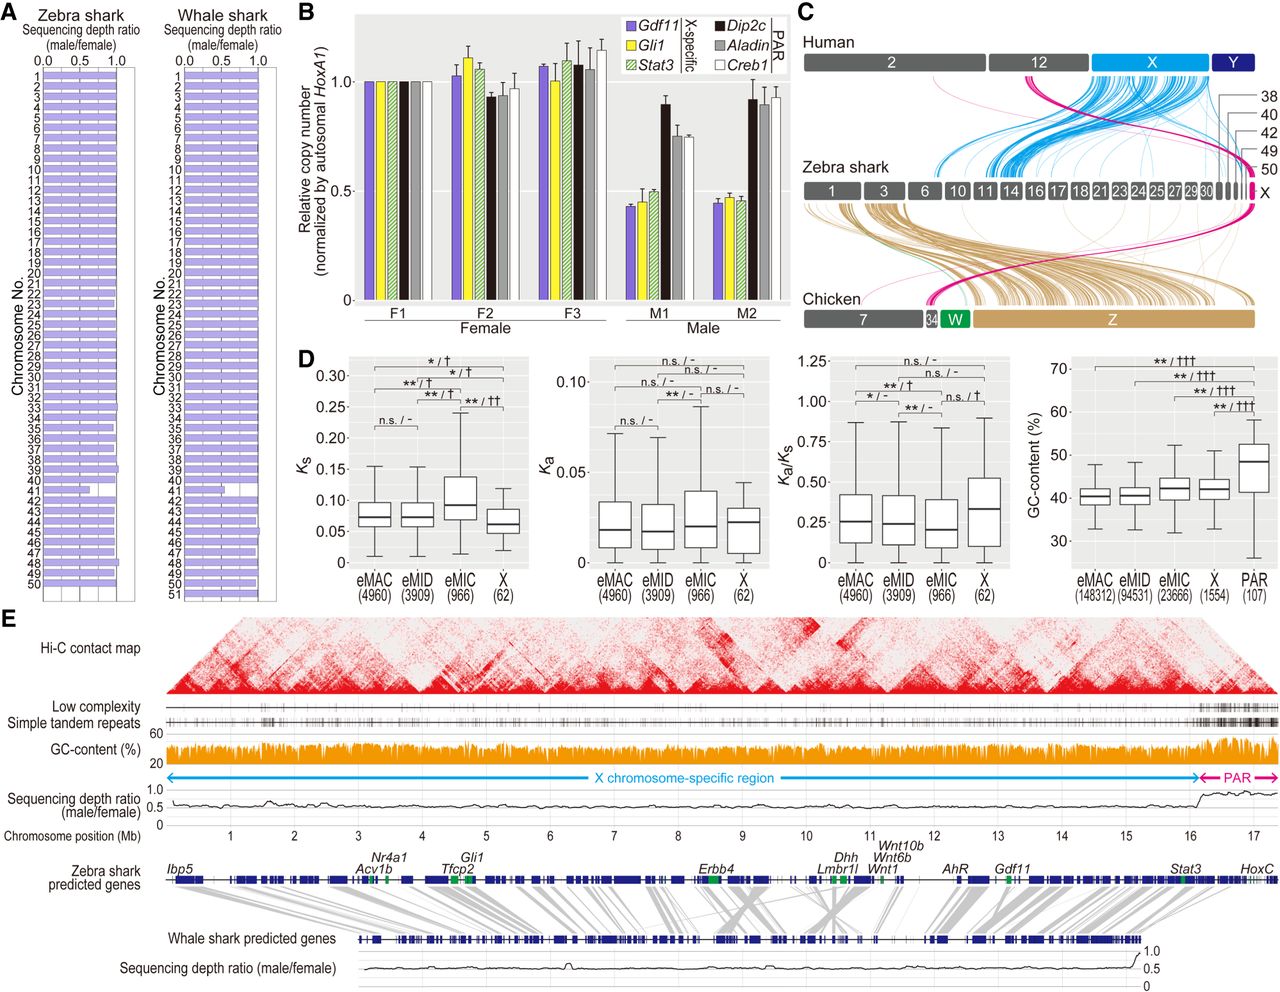
Genomic identification of the zebra shark Chromosome X. (A) Male–female ratio of short-read sequencing depth in the shark chromosomes. (B) Male-female copy-number difference of zebra shark Chromosome X. Amplification levels of the genes on the PAR and the remainders of Chromosome X (scaffold 41) was quantified using real-time PCR controlled with amplification of autosomal genomic regions, by normalizing the PCR product abundance with that for the individual F1 (sSteFas1) (see Methods). (C) Cross-species synteny of sex chromosome-linked genes based on 1-to-1 orthologs. (D) Characteristic comparisons between the different chromosome categories in the zebra shark. Ks (synonymous substitution rate) and Ka (nonsynonymous substitution rate) values were calculated for 1-to-1 orthologs shared with the whale shark. Only for GC content, the PAR was shown separately, because it contained few genes. Significance of difference is indicated as follows: (*) P-value < 0.05/number of tests, (**) P-value < 0.01/number of tests; (n.s.) not significant. The effect sizes are indicated with a hyphen for no effect, one dagger symbol “†” for small effect, two dagger symbols “††” for medium effect, and three dagger symbols “†††” for large effect in statistical tests. Numbers of the genomic regions sampled are shown in parentheses. See Methods for more details about statistical tests. (E) Structural comparison between the zebra shark and whale shark X Chromosome sequences. We focused more on the zebra shark because we could not retrieve a part of the whale shark chromosome that is homologous to the putative zebra shark Chromosome X.


