
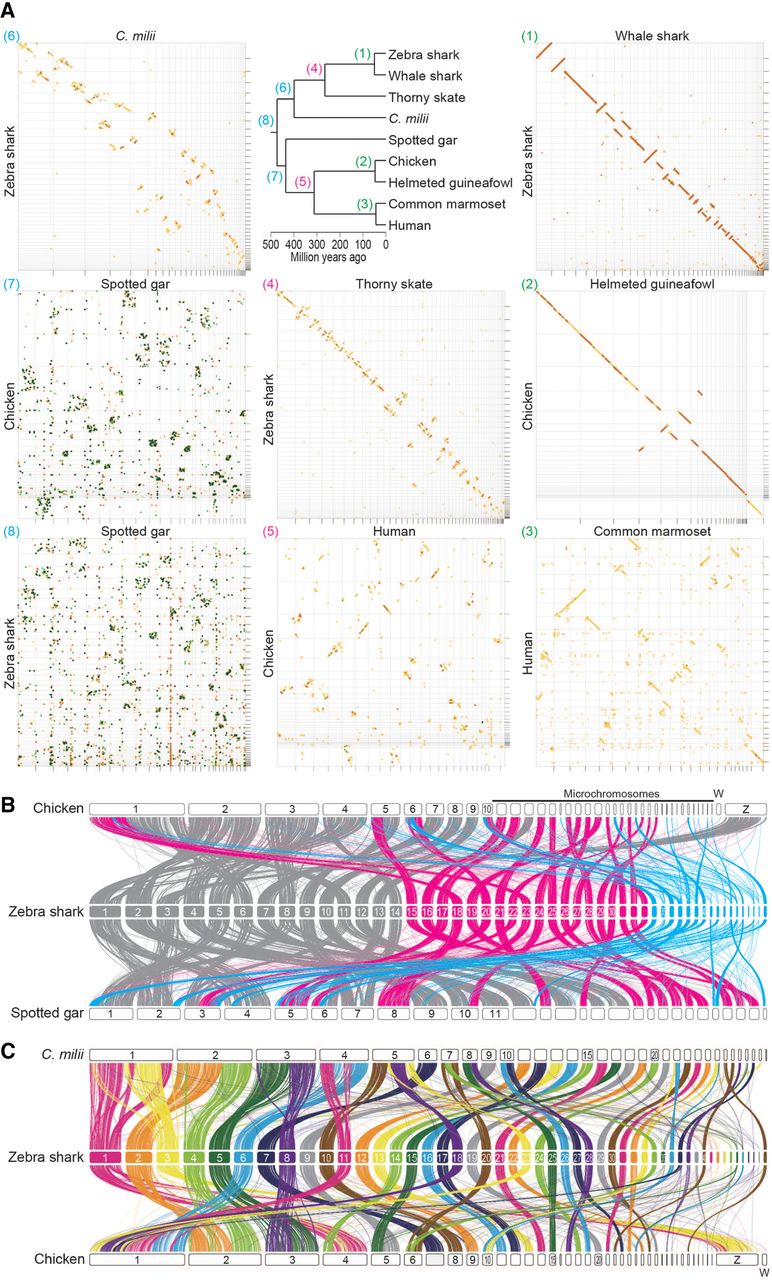
Cross-species investigation of chromosomal homology. (A) Dot matrices showing genome sequence similarities for selected pairs of vertebrate species with variable divergence times. Sequences of high similarity are shown with diagonal lines by the program D-GENIES (Cabanettes and Klopp 2018) with the “Many repeats” mode. The numbers given to the individual panels (1) to (8), correspond to those at the nodes in the phylogenetic tree and are colored differentially to indicate comparable divergence times. Diagonal lines are colored according to the level of sequence divergence (dark green, 75%–100%; light green, 50%–75%; orange, 25%–50%; yellow, 0%–25%). (B) Chromosomal homology suggested by synteny conservation of one-to-one ortholog pairs. See Methods for details. The color of the ribbons connecting the synteny represents each of the three categories of the zebra shark chromosomes: eMAC (gray); eMID (magenta); and eMIC (cyan). (C) Chromosomal homology between the zebra shark and other vertebrates. Conserved synteny is visualized with the inter-specific correspondence of one-to-one orthologs (see Methods).


