
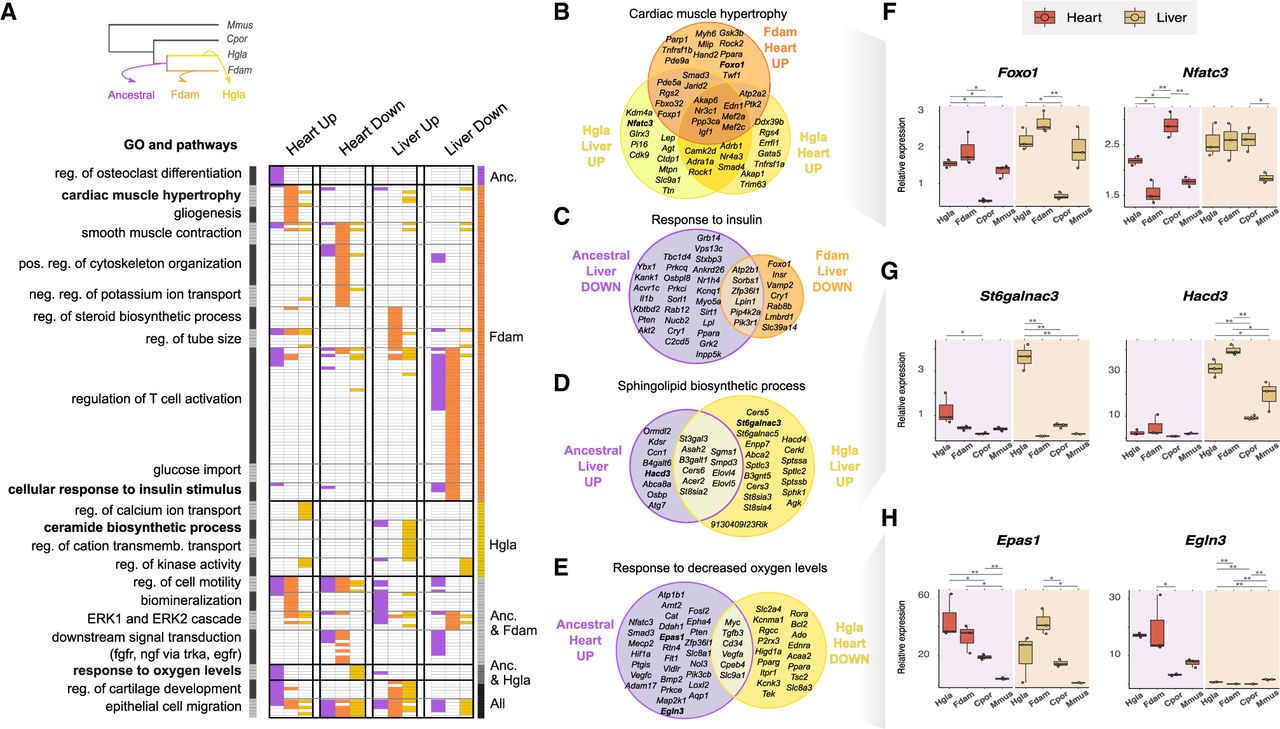
Comparison of GOs and pathways enriched in enhancers with an activity shift in ancestral and single-species mole-rat branches. (A) GO terms significantly associated to enhancers with activity shifts in mole rats across different branches (top left inset) and tissues. Similar GO terms and pathways were grouped in clusters (left axis; Methods). Each row in the heatmap is a GO term or pathway within a cluster, with its presence (colored) or absence (white) indicated in each enhancer set. Columns correspond to the different tissues and shift directions; colors, to the branches (top left inset). Clusters are ordered to highlight terms enriched in particular branches (right axis). The complete list of enriched terms and cluster membership is available in Supplemental Table S10. (B–E) Selected examples of GO terms enriched across enhancers of different branches or tissues. Venn diagrams show the overlap between genes associated with shifted enhancers of each set (Methods). (F–H) Relative gene expression levels for loci associated with cardiac hypertrophy (F), sphingolipid biosynthesis (G), and response to hypoxia (H). Representation as in Figure 3F. See also Supplemental Figures S7 and S9 and Supplemental Table S10.


