
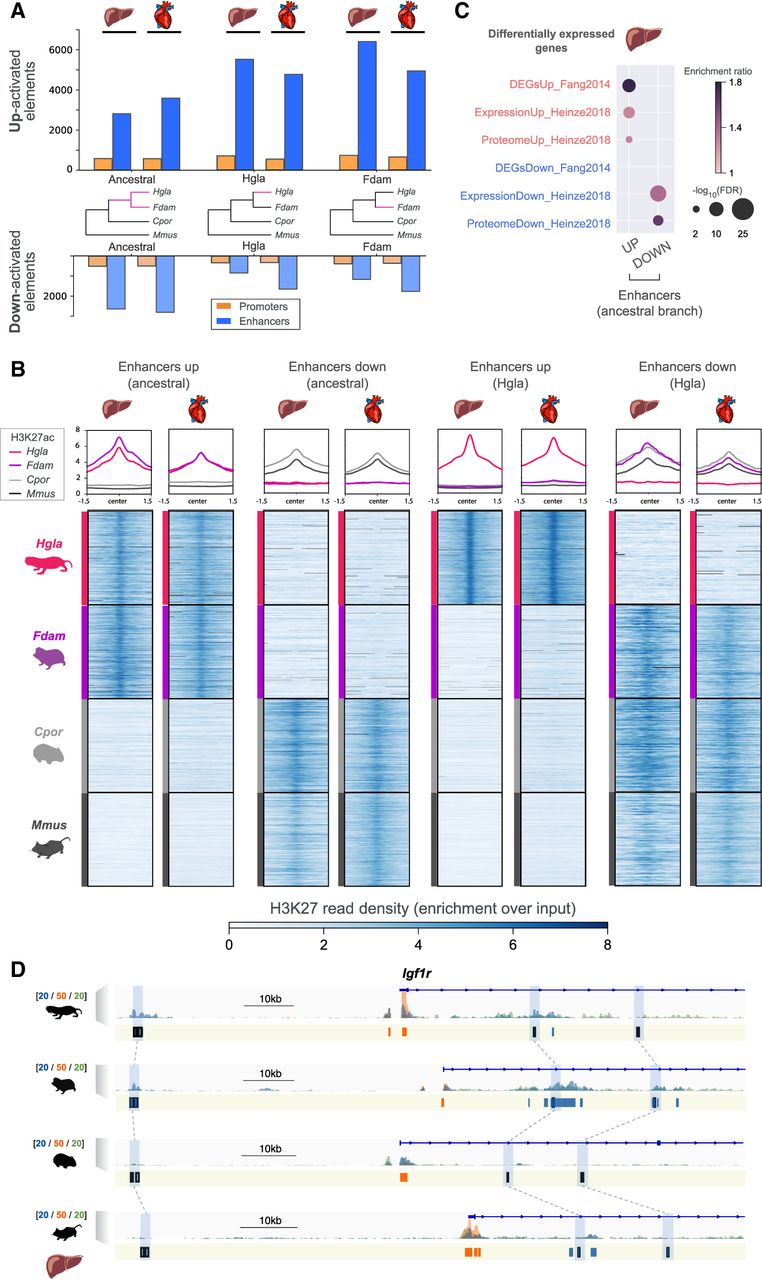
Identification of promoters and enhancers with an activity shift in mole-rats. (A) Number of regulatory elements identified via phylogenetic modeling with an increase (up) or decrease (down) in activity in the indicated branches of the species tree: mole-rat ancestral (ancestral), naked mole-rat (Hgla), and Damaraland mole-rat (Fdam). (B) H3K27ac read density heatmaps and profile plots for up and down enhancers in the ancestral and naked mole-rat branches. Reads densities are presented as fold enrichment over input, averaged across biological replicates. Profile plots show distributions in a 3-kb window. (C) Liver enhancers with an ancestral activity shift in mole-rats are significantly associated with previously identified differentially expressed genes in mole-rats liver (GREAT enrichment tests; Methods). (D) Example of liver enhancers up-regulated in the ancestral mole-rat branch and associated with the Igf1r insulin response locus. H3K27ac (blue), H3K4me3 (orange), and H3K4me1 (green) histone mark enrichment in the liver around Igf1r; scale units are as in Figure 1A. Promoters are shown in orange; enhancers, in blue. Up enhancers are identified by black boxes and linked by light blue boxes and dashed lines across species. See also Supplemental Figures S3 through S7 and Supplemental Tables S2 and S3.


