
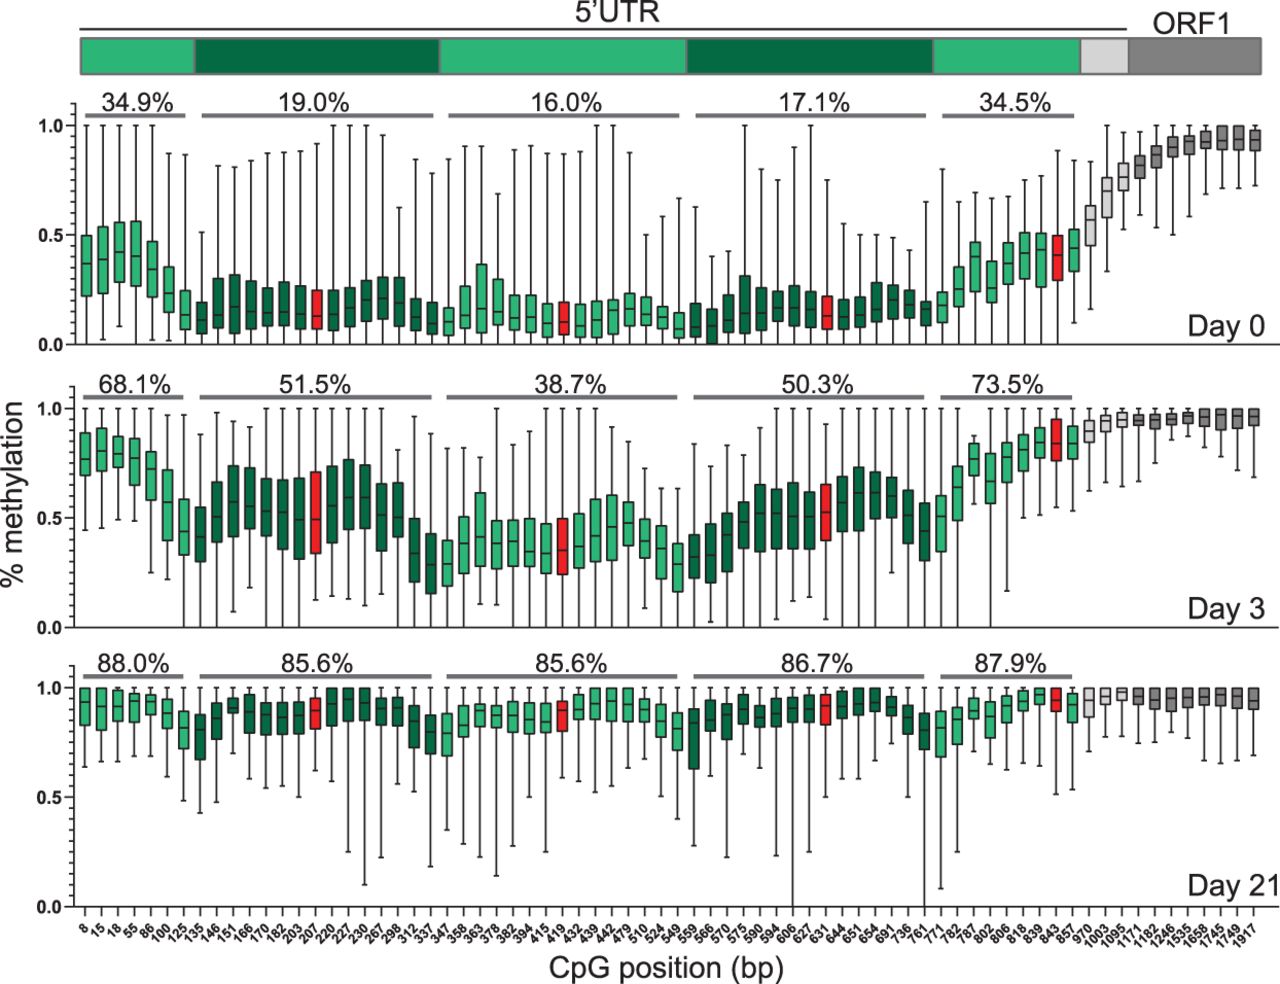
Methylation of individual CpG dinucleotides across the L1 TF promoter. Box-and-whisker plots display the median percent methylation determined by ONT sequencing for individual CpG dinucleotides across the L1 TF promoter for at least 20 individual L1 loci containing five monomer units, at d0 (top), d3 (middle), and d21 (bottom) of differentiation. The CpG positions along the x-axis are derived from a representative five monomer L1 TF sequence used in our analysis (Supplemental Table S1). The central line represents median percent CpG methylation; box indicates interquartile range. Whiskers represent the top and bottom quartiles. Alternating green shading indicates CpGs belonging to each monomer unit, corresponding to the schematic of the L1TF 5′ UTR, above. The CpG dinucleotide partially encompassed by the core YY1 binding site is shown in red. Above each monomer unit for each box plot is shown the average percent methylation among all ≥20 L1 loci across all CpGs present within the monomer unit.


