
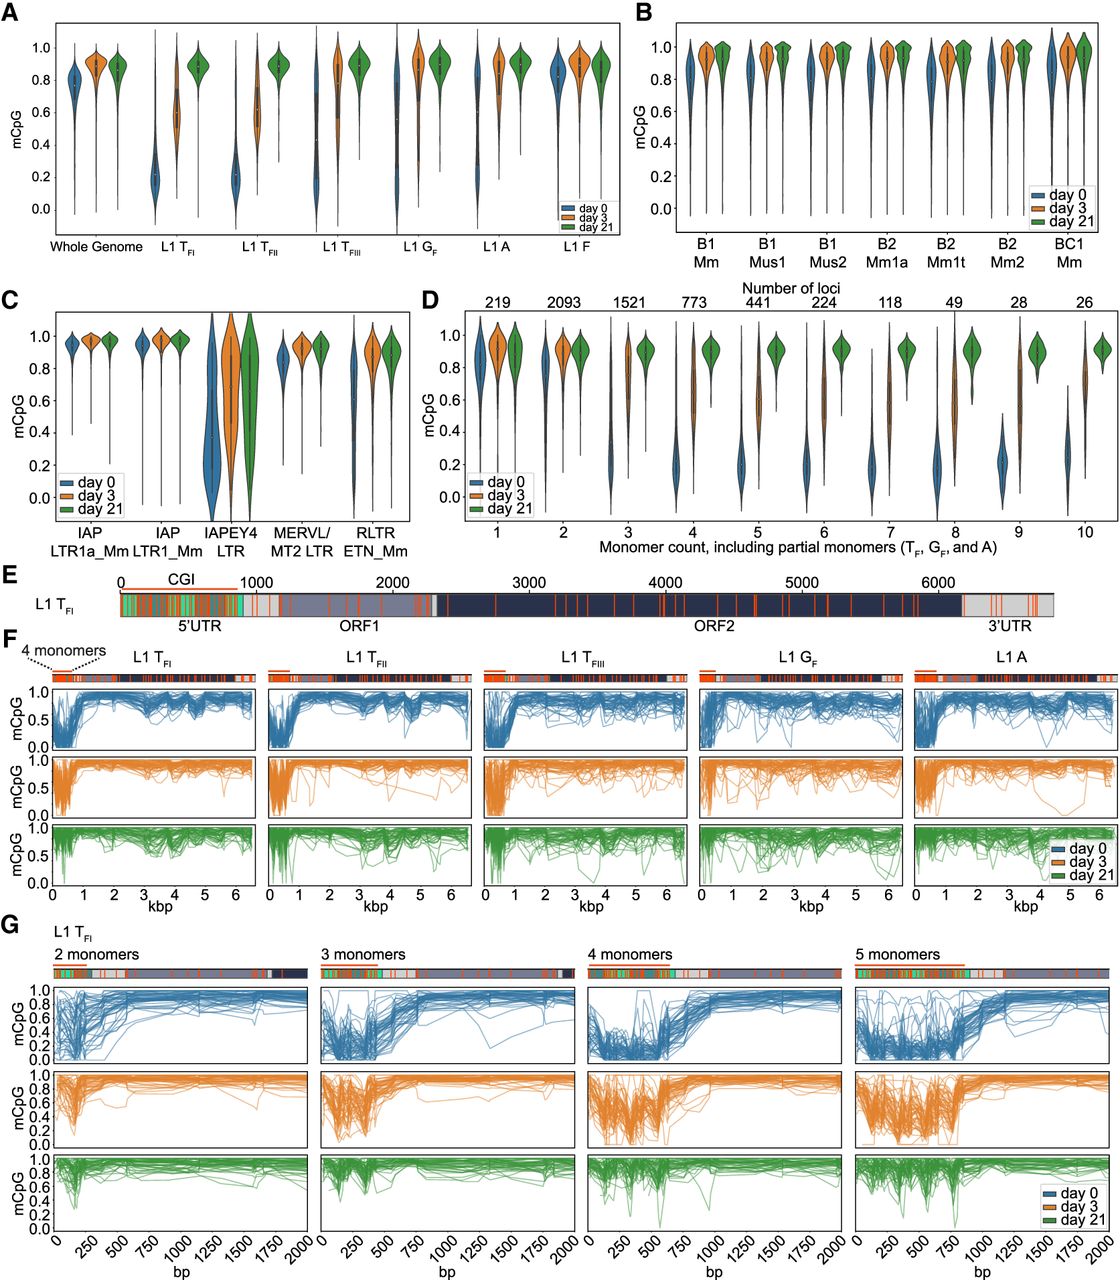
ONT CpG methylation profiles of TEs. (A) Violin plots are showing methylated CpG fraction for the whole genome (6 kbp windows), L1 5′ UTRs belonging to the active L1 TFI, TFII, TFIII, GF and A subfamilies and the evolutionary older and inactive L1 F subfamily at three time points of differentiation: d0 (undifferentiated mESCs in serum + LIF), d3 (EBs on day 3 of differentiation) and on d21 (completely differentiated cells). (B) As for (A), but for B1, B2 and BC1 SINE subfamilies. (C) As for (A), but for IAP LTR1a_Mm and LTR1_Mm, IAPEY4 LTR, MERV-L/MT2 LTR and RLTR ETn_Mm copies. (D) As for (A), but for violin plots showing the methylated CpG fraction of active L1 subfamily (TF, GF, and A together) promoters (monomers only) depending on the number of monomers (including partial monomers). Only elements with a minimum coverage of five reads across the whole 5′ UTR were included in the plot. The number of loci represented in each bin is shown in the top. (E) Annotated full-length L1 TF1 consensus showing the monomer units in green, unique region in light gray, ORF1 in dark gray, ORF2 in dark green, and 3′ UTR in light gray. CpG dinucleotides throughout the whole element are displayed as orange strokes. The promoter CpG island (CGI) is indicated as an orange line. Number of bp are shown above the element. (F) Data is shown for full-length L1s (TFI, TFII, TFIII, GF and A) containing four monomers in the promoter at three time points of differentiation: d0 (undifferentiated mESCs in serum + LIF), d3 (EBs on day 3 of differentiation), and on d21 (completely differentiated cells). Each graph displays up to 50 methylation profiles for the specified L1 subfamily. Annotated consensus sequences as per (E) are shown at top including CpG positions. (G) As for (F), but for promoters of L1 TFI subfamily members containing between 2 and 5 monomers at three time points of differentiation (d0, d3, and d21).


