
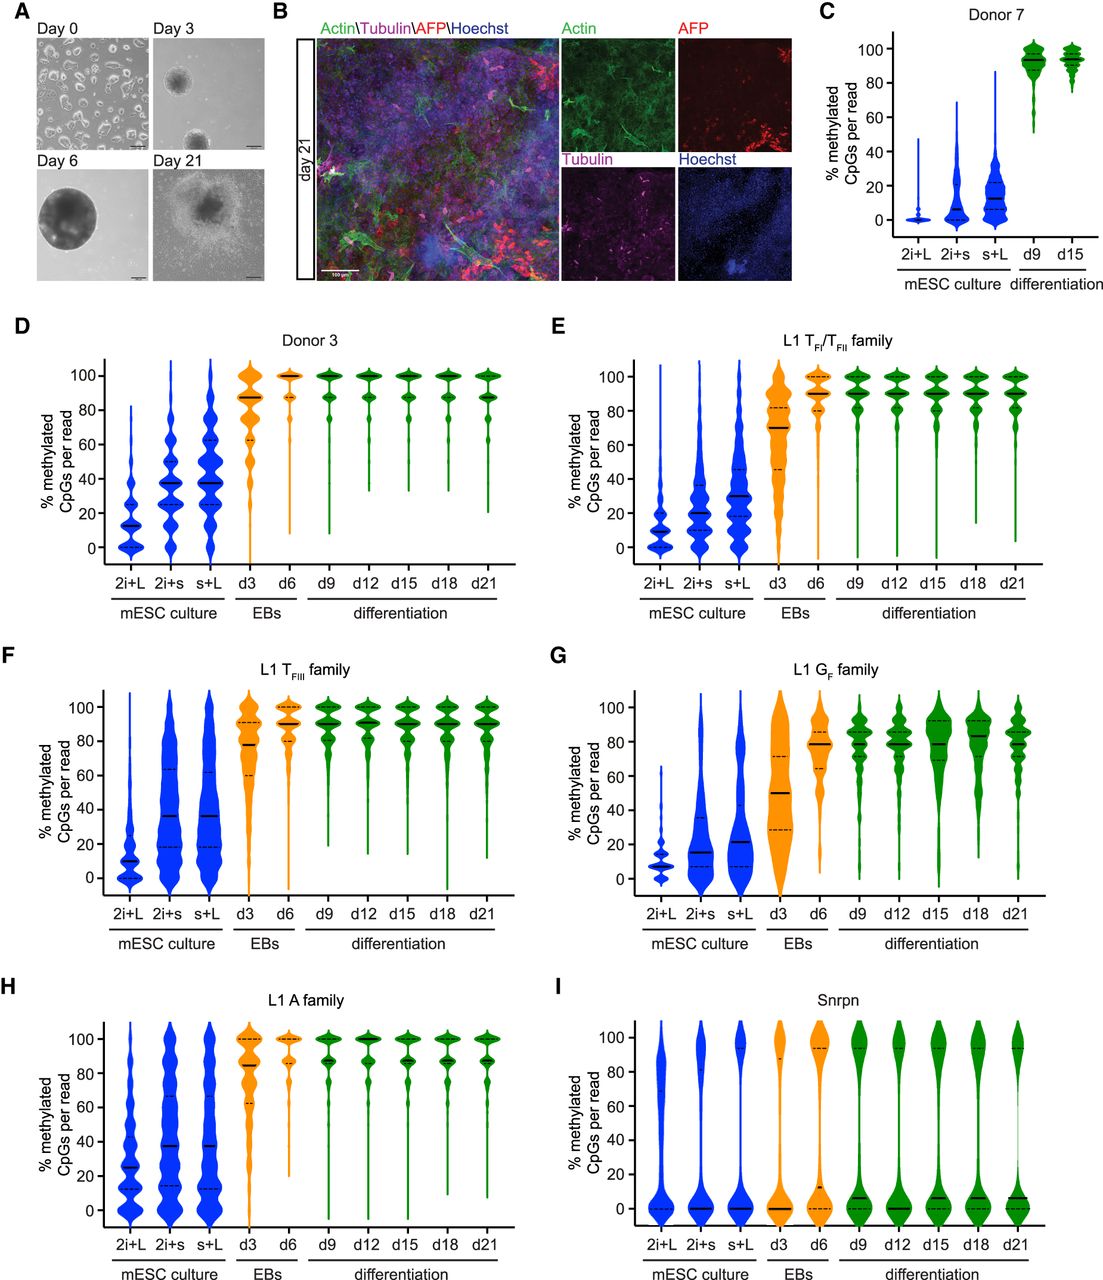
Dynamic methylation of L1 elements during differentiation of mESCs. (A) Differentiation of mESCs to cells of all three germ layers using a standard differentiation protocol (Behringer et al. 2016). Undifferentiated E14 mESCs are grown on gelatin (day 0). Embryoid bodies (EBs) are generated by “hanging drop culture” (day 3) and are grown in suspension culture (day 6). After 6 d, EBs are plated and differentiated for 2 wk (day 21). Scale bar, 200 µm. (B) Immunofluorescence image of mesodermal (Actin, green), endodermal (AFP, red) and ectodermal (Tubulin, violet) lineage markers in differentiated E14 mESCs on day 21. Nuclei were stained with Hoechst (blue). Scale bar, 100 µm. (C) Methylation of Donor 7 promoter sequence shown in the mESCs cultured in three different conditions (2i + L = 2i + LIF, 2i + s = 2i + serum, s + L = serum + LIF) and on differentiation day 9 (d9) and day 15 (d15). Because of the technical challenge posed by PCR amplification of long bisulfite-treated fragments, sufficient material was generated to assess Donor 7 methylation only at day 9 and day 15 of differentiation. Displayed are 1000 nonidentical sequences (if available) extracted at random from a much larger pool of available Illumina reads (exceptions: Donor 7: 2i + LIF, 2i + serum, serum + LIF, d9, d15 [874, 837, 876, 110, 124 reads, respectively]). The violin plots represent the methylation distribution as per Supplemental Figure S4. The black line and dashed lines show the distribution median and quartiles, respectively. (D–I) As for (C) but for Donor 3 (D), L1 TFI/ TFII family (E), L1 TFIII family (F), L1 GF family (G), L1 A family (H), and the imprinted gene Snrpn (I). Primers for L1 families are within the L1 promoter sequence. Shown is methylation in three different mESC culture conditions, during EB culture and during differentiation. Displayed are 1000 nonidentical sequences (if available) extracted at random from a much larger pool of available Illumina reads (exceptions: L1 GF family: 2i + LIF, 2i + serum, serum + LIF, d3, d6, d9, d12, d15, d18, d21 [86, 127, 119, 120, 168, 162, 161, 155, 155, 175 reads, respectively]).


