
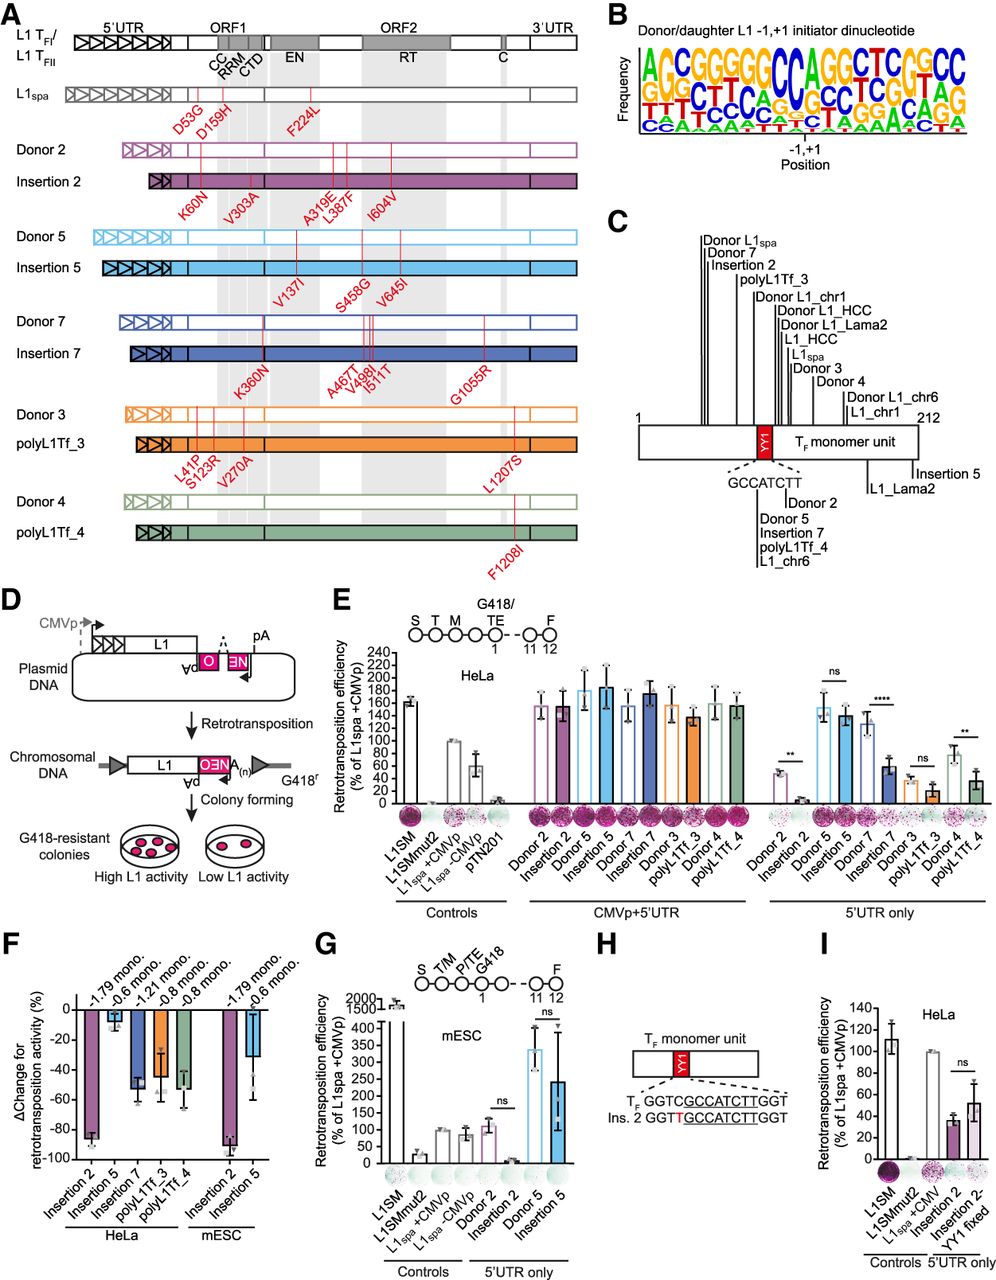
L1 donor/daughter pairs retrotranspose efficiently in vitro. (A) Amino acid changes in ORF1 and ORF2 compared to the L1 TFI and L1 TFII consensus sequences (Sookdeo et al. 2013) are annotated in red. L1spa refers to the published disease-causing insertion used in later experiments (Naas et al. 1998). Functional domains in ORF1 and ORF2 are shown: CC = coiled-coiled, RRM = RNA recognition motif, CTD = C-terminal domain, EN = endonuclease, RT = reverse transcriptase, C = cysteine-rich motif. Triangles within the 5′ UTR represent monomer units. For nucleotide substitutions in promoters see Supplemental Figure S1. (B) Sequence logo (Crooks et al. 2004) of putative transcription initiation start sites for all ten donor and daughter L1 pairs. Sequence represents transcription initiator dinucleotide in the center ± 9 nucleotides upstream and downstream. −1,+1 indicates transcription initiator dinucleotide. The first nucleotide of L1 sequence corresponds to the second nucleotide in transcription initiator dinucleotide. The position of the first base of each daughter L1 relative to its donor element, and the first base of each donor L1 relative to the L1 TFI/TFII consensus sequences was analyzed. (C) Donor and daughter L1 5′ truncation points. Sequences or locations of donors and daughters were previously published as indicated in Table 1 (Kingsmore et al. 1994; Naas et al. 1998; Besse et al. 2003; Richardson et al. 2017; Schauer et al. 2018; Gagnier et al. 2019). Lines indicate truncation points of elements in the 5′-most monomer. YY1 binding site (GCCATCTT) is shown in red. (D) Rationale of a cultured cell retrotransposition assay (Moran et al. 1996; Wei et al. 2000). Constructs used in this study were previously published (Moran et al. 1996; Goodier et al. 2001; Han and Boeke 2004) or generated by modifying the pTN201 construct [L1spa (Naas et al. 1998)]. An antisense orientated neomycin-resistance (NEOr) reporter cassette interrupted by a sense-oriented intron is inserted into a mouse L1 3′ UTR. The mouse L1 is driven by its native 5′ UTR promoter or a CMV promoter (CMVp). Cells harboring a retrotransposition event become neomycin (G418) resistant. The colony number reflects the relative activity of the L1 construct. (E) Comparison of L1 donor/daughter pair retrotransposition efficiency in HeLa cells. The retrotransposition assay timeline is shown in the top (S: seeding, T: transfection, M: change of media, G418: start of G418 selection, TE: measurement of transfection efficiency, F: Fixing and staining of colonies). Constructs: L1SM (positive control), L1SMmut2 (negative control), pTN201, L1spa +CMVp/−CMVp, L1 donor/daughter pairs +CMVp/−CMVp. Colony counts were normalized to L1spa + CMVp and are shown as mean ± SD of three independent biological replicates, each of which comprised three technical replicates. (*) P ≤ 0.0332, (**) P ≤ 0.0021, (***) P ≤ 0.0002, (****) P < 0.0001, ns = not significant (One-way ANOVA followed by Sidak's post-hoc test, P = 0.0060, 0.7632, <0.0001, 0.5652, 0.0066 for donor/daughter pairs –CMVp from left to right). Representative well pictures are shown below each construct. 5 × 10³ cells were plated per well in a six-well plate. (F) Percentage change (ΔChange) in retrotransposition activity between L1 donor/daughter pairs. Shown is the decrease of retrotransposition efficiency per daughter L1 compared to its respective donor L1. Data is shown as mean ± SD of three independent biological replicates. (G) Comparison of L1 donor/daughter pair retrotransposition efficiency in mESCs. The retrotransposition assay timeline is shown at the top (S: seeding, T: transfection, M: change of media 8 h after transfection, P: passaging of cells into 10 cm plates, TE: measurement of transfection efficiency, G418: start of G418 selection, F: Fixing and staining of colonies). Constructs as described in (E). Colony counts were normalized to L1spa + CMVp and are shown as mean ± SD of three independent biological replicates, each of which comprised two technical replicates. (*) P ≤ 0.0332, (**) P ≤ 0.0021, (***) P ≤ 0.0002, (****) P < 0.0001, ns = not significant (One-way ANOVA followed by Sidak's post-hoc test, P = 0.2851, 0.3305 for donor/daughter pairs –CMVp from left to right). Representative well pictures are shown below each construct. 4 × 10⁵ cells were plated per well in a six-well plate. (H) Schematic of an L1 monomer unit. The YY1 binding site is indicated as red rectangle. The extended YY1 binding motif sequence is shown below. The core YY1 binding motif sequence is underlined. A mutation in the extended YY1 binding motif sequence adjacent to the core motif in Insertion 2 is indicated in red. (I) Comparison of retrotransposition efficiency of Insertion 2 and Insertion 2 with intact YY1 binding sites (Insertion 2-YY1 fixed) in retrotransposition assay in HeLa cells. Constructs as described in (D). Colony counts were normalized to L1spa in pCEP4-mneoI-G4 + CMVp and are shown as mean ± SD of three independent biological replicates, each of which comprised three technical replicates. (*) P ≤ 0.05, ns = not significant (two-tailed t-test, P = 0.1607). Representative well pictures are shown below each construct. 1 × 10⁴ cells were plated per well in a six-well plate. Note: L1SM retrotransposed very efficiently, leading to cell colony crowding in wells, and a likely underestimate of retrotransposition.


