
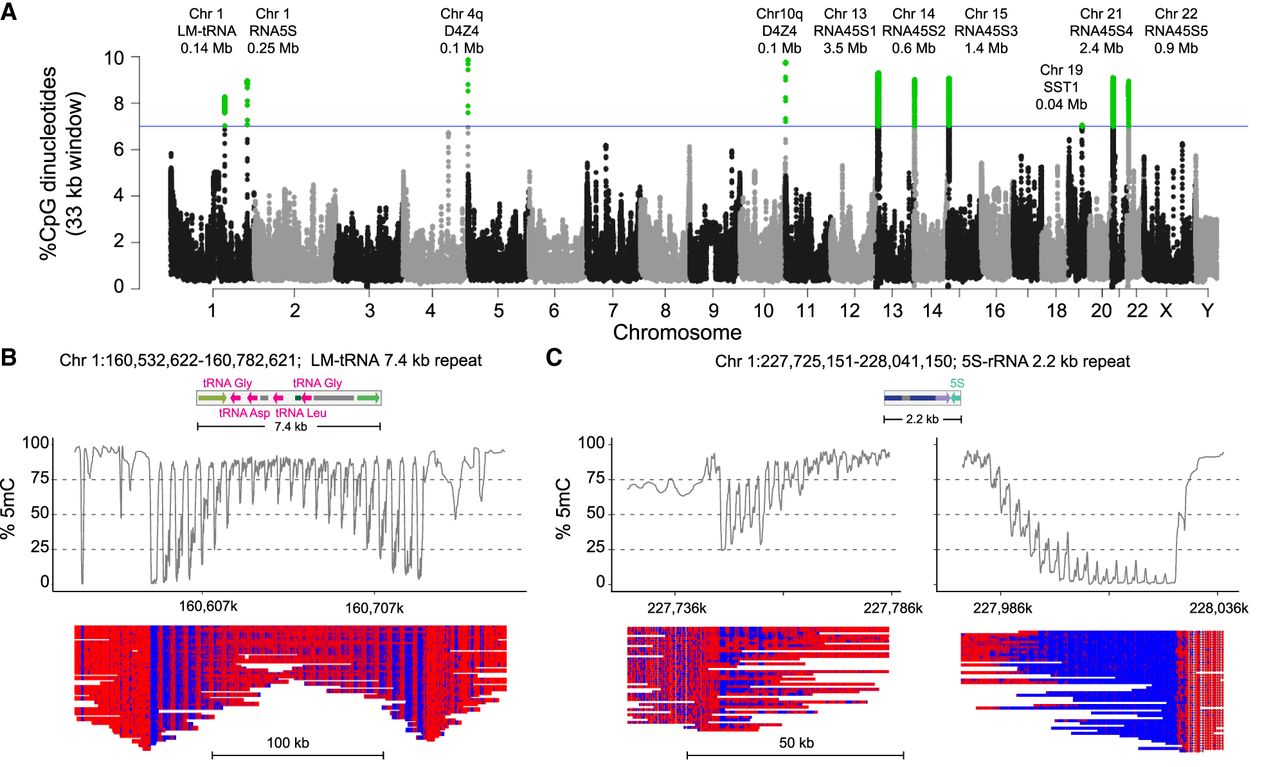
Figure 6.
Methylation gradients in other CpG-dense repeat regions. (A) Manhattan plot of CpG density in 33 kb sliding windows (step size = 3.3 kb) across the T2T CHM13 v2.0 genome. Windows above 7% CpG density are marked as green dots. Alignment and methylation plots of untargeted reads from the C4 control (R10.4.1_e8.2 nanopores) mapped to (B) the LM-tRNA cluster on Chromosome 1 and (C) the 5S rRNA cluster on Chromosome 1. Mapped reads are anchored by unique flanking sequence and the two ends of the 5S rRNA cluster are shown separately.


