
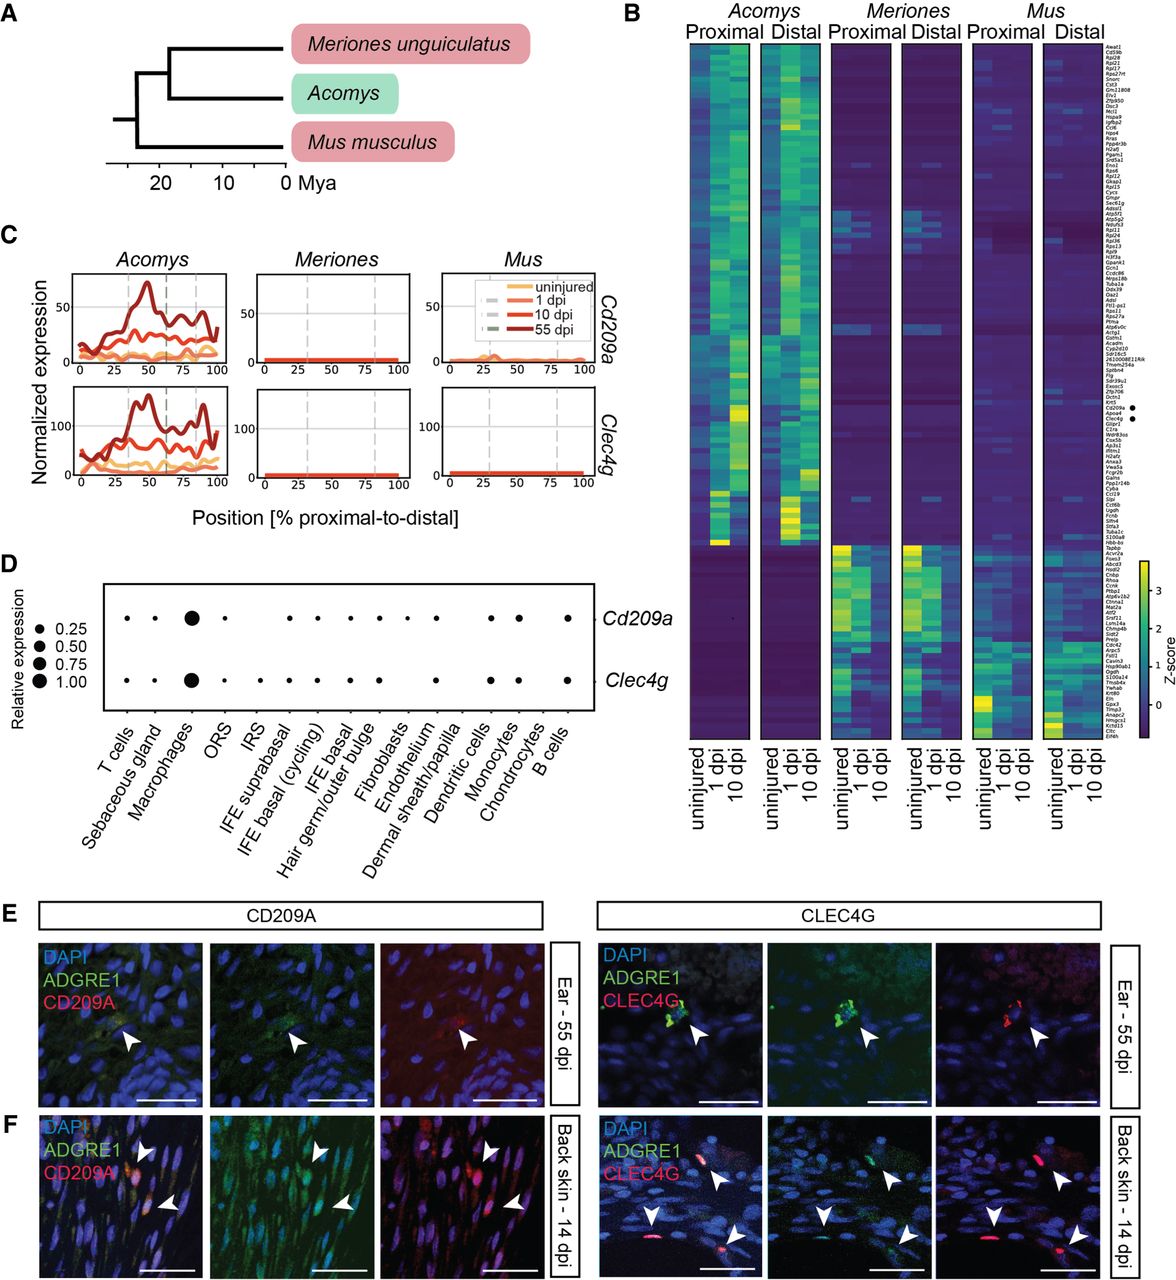
Spatial comparison with the nonregenerating rodents Mus musculus and Meriones unguiculatus. (A) Phylogenetic tree showing relationships (in million years ago [mya]) between Acomys (“regenerator”), Meriones unguiculatus and Mus musculus (“nonregenerators”) (http://www.timetree.org). (B) Heat map containing two species specific clusters from the top 500 differentially expressed genes between the proximal/distal wound edge and the corresponding uninjured tissues, at 1 and 10 dpi, for Acomys, M. musculus, and M. unguiculatus. (C) Line plot with the normalized expression of Cd209a and Clec4g at the uninjured time point and at 1, 10, and 55 dpi in Acomys, M. unguiculatus, and M. musculus. (D) Dot plot visualization of gene expression of Cd209a and Clec4g in various cell types in single cell control data for Acomys. (E,F) Visualization of macrophages at the wound site of regenerating Acomys ear tissue (proximal side; 55 dpi) (E) or of regenerating Acomys back skin (14 dpi) (F) with an ADGRE1 antibody (green) and CLEC4G or CD209A (red) antibodies. Nuclei are blue (DAPI). Scale bar, 50 μm. (See Supplemental Fig. S8; Supplemental Tables S5, S6.)


