
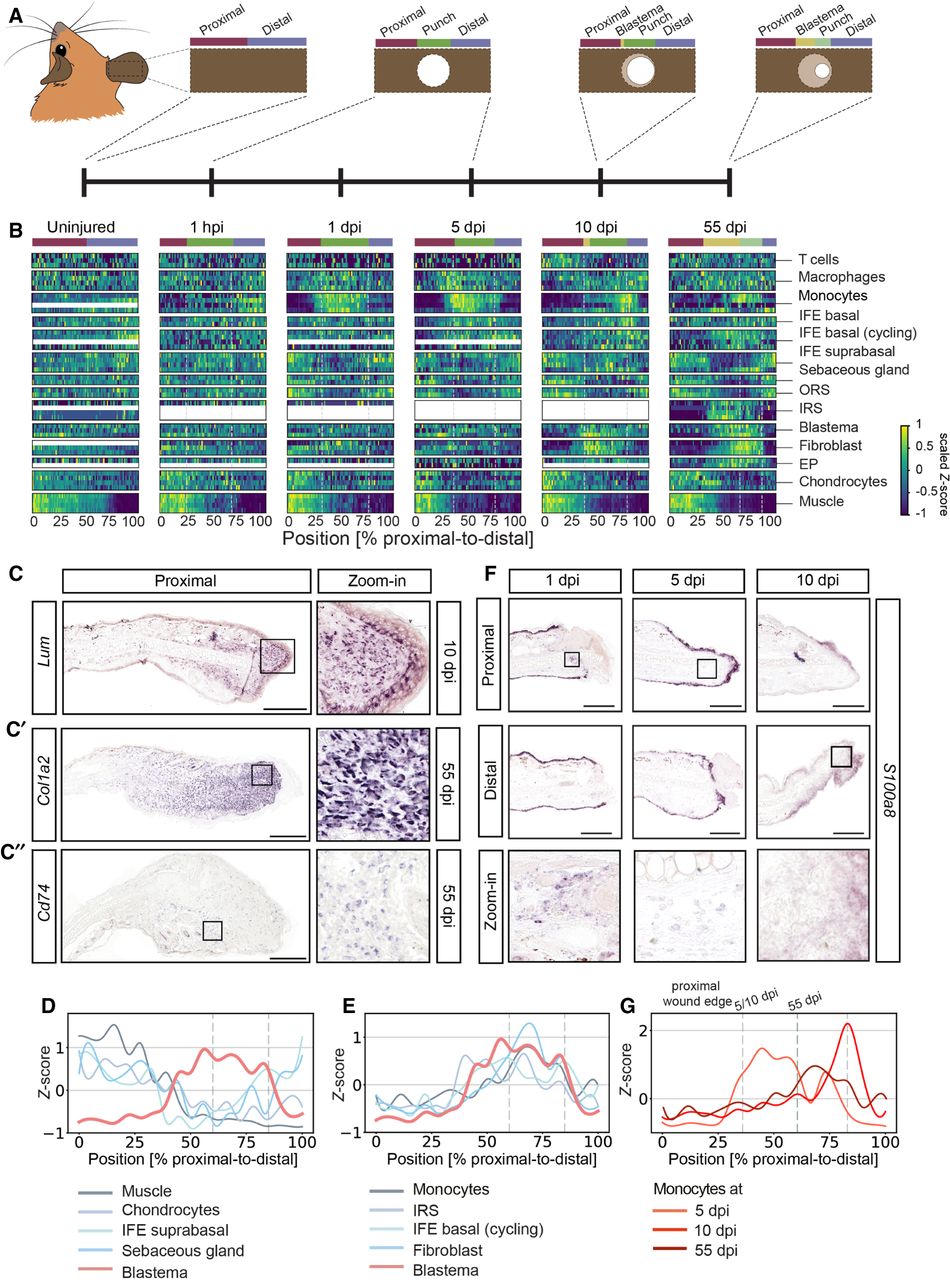
tomo-seq identifies dynamic behavior of different cell types during ear regeneration. (A) Schematic overview of the analyzed tomo-seq samples, indicating different regions. The dotted line indicates the original amputation plane. (B) Heat map showing the average proximal–distal expression pattern of various marker genes for different cell types. n = 3 for all regeneration time points, n = 2 for uninjured samples. The white dotted lines indicate the open area. Relative higher expression in yellow and lower in blue. See Supplemental Table S2 and Supplemental Figure S3 for cell type–specific marker genes and individual line plots. (EP) Epiphyseal plate, (IFE) interfollicular epidermis, (IRS) inner root sheath, (ORS) outer root sheath. (C) In situ hybridization against blastema markers at different time points after injury: Lum (C), Col1a2 (C′), and Cd74 mRNA (C′′) on proximal ear sections. (D,E) Line plot with averaged expression patterns of cell type–specific marker genes at 55 dpi that either negatively (D) or positively correlate (E) with the expression of blastema marker genes. The dotted line indicates the open ear punch area. (F) In situ hybridization of S100a8 mRNA, a monocyte marker, at the proximal and distal wound edge at 1, 5, and 10 dpi. All scale bars, 100 μm. (G) Line plot with averaged expression patterns of marker genes for monocytes at 5, 10, and 55 dpi. The dotted line indicates the open ear punch area. (See also Supplemental Fig. S3; Supplemental Table S2.)


