
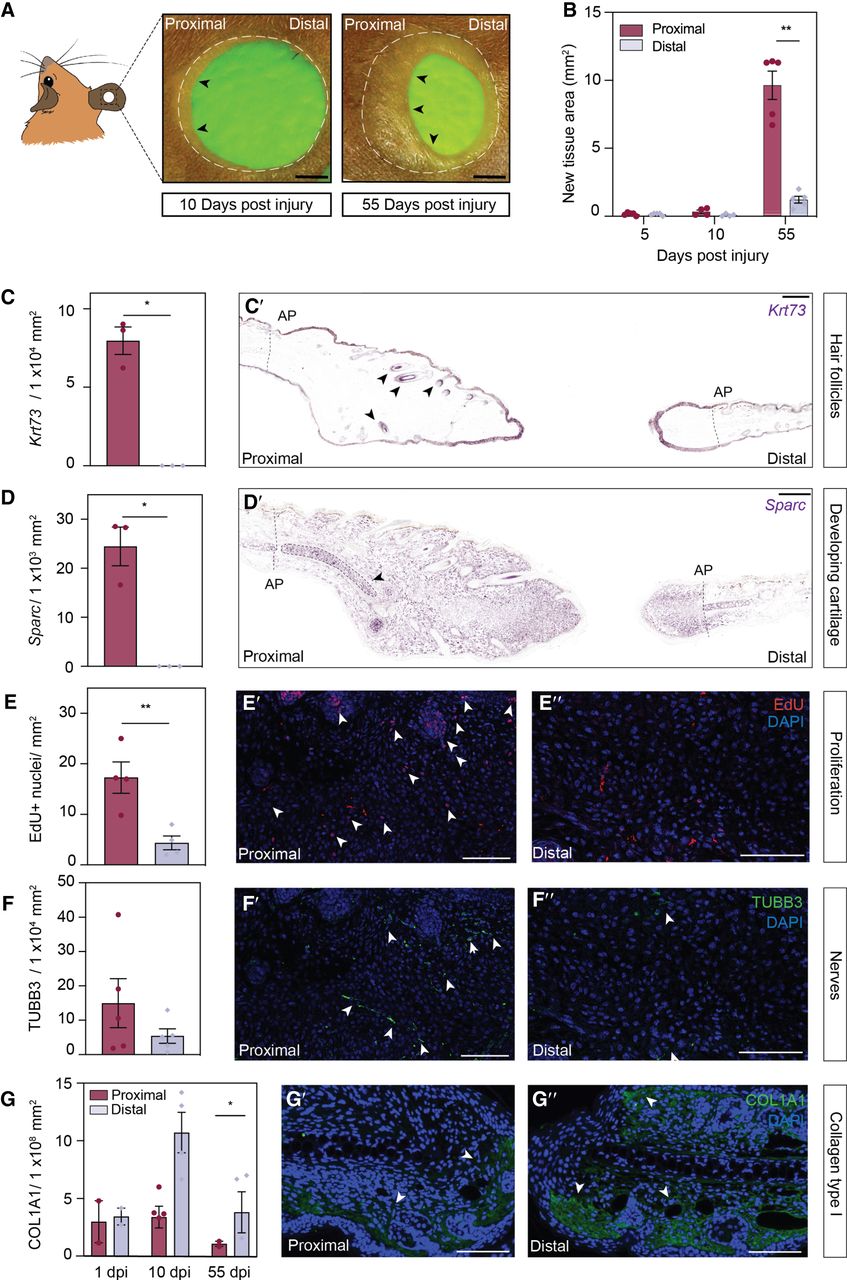
Quantification of asymmetric ear regeneration in Acomys. (A) Regeneration of a 4-mm ear punch. Images were taken at 10 and 55 d post injury (dpi). Dotted line: original amputation plane; arrows indicate newly formed tissue. Scale bar: 1 cm. (B) Quantification of new tissue area at proximal and distal wound sites at 5, 10, and 55 dpi. N = 5. (C,D) In situ hybridization on proximal and distal ear sections (55 dpi) against Krt73 (C′) and Sparc (D′) mRNA. Barplots represent numbers of Krt73+ hair follicles (n = 3) and Sparc+ cells in the newly formed cartilage, respectively. (E) 5-ethynyl-2′-deoxyuridine (EdU) staining of proximal (E′) and distal (E′′) ear sections. n = 4. (F) Nerve cell staining and quantification (positive area) of proximal (F′) and distal (F′′) ear sections with a TUBB3 antibody. n = 5. (G) Representative images and quantifications (positive area) of proximal (G′) and distal (G′′) ear sections stained with a COL1A1 antibody. 1 dpi n = 2, 10 dpi n = 4, 55 dpi n = 3. All barplots are represented as mean ± SEM, paired t-test. Scale bar: 100 μm. Asterisks indicate significance ([∗∗] P < 0.01; [∗] P < 0.05). Arrows indicate positive staining. (See also Supplemental Fig. S1.)


