
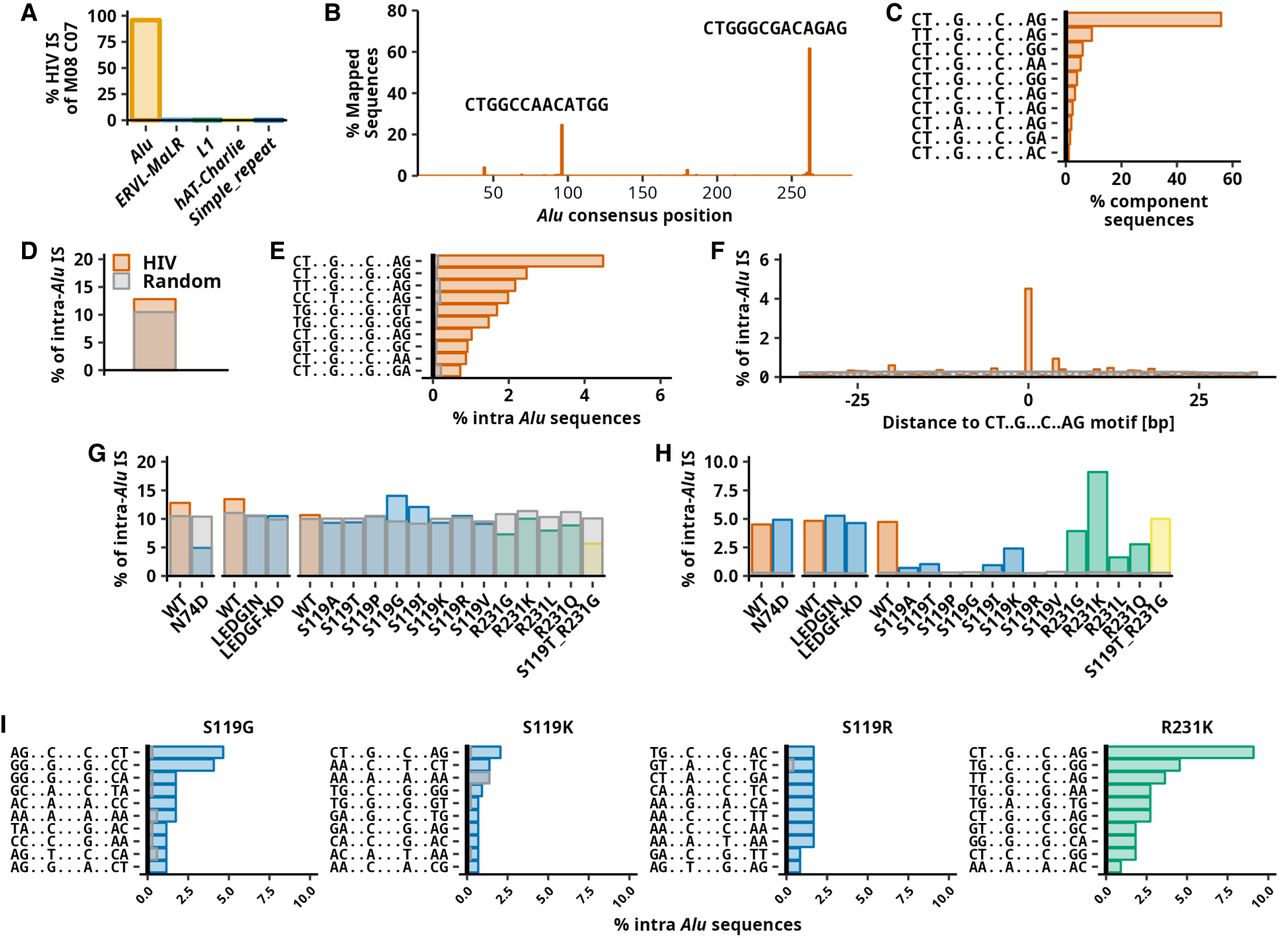
Characterization of HIV integration hotspot in Alu repeats. (A–C) The characterization of HIV-1 IS sequences associated with component C07 of an eight-component mixture. (A) Barplot showing the frequency of 1596 component-associated ISs in repetitive elements. Five repeat families with the most ISs are depicted. (B) Intra-Alu component-associated sequences mapped to Alu consensus sequence. The plot shows single-base binned consensus positions (length 290 bp) and a percentage of 1063 sequences mapped to individual positions of Alu consensus. Sequences of the two most frequent positions in the Alu consensus sequence are displayed. (C) Frequency of sequence motifs in sequences associated with component C07. The 10 most frequent sequence motifs are shown. In sequence motifs, dots (“.”) substitute any nucleotide. (D–F) Data for HIV-1 obtained from the complete HIV IS set. (D) Barplot showing a frequency of IS found in Alu repeats. The gray bar represents the expected random targeting of Alu repeats. (E) Frequency of the sequence motifs among intra-Alu IS. Gray bars represent the mean expected frequency. The 10 most frequent sequence motifs are shown. (F) Frequency of integration into and in proximity to the most frequently targeted motif CT..G…C..AG. Plots show the frequency of intra-Alu IS 33 bp downstream from and upstream of the motif relative to Alu repeat orientation. (G–I) Results of the same analysis as shown for D–F performed for different studies. Each experimental set contains a control with normal (WT) integration preference. N74D is HIV-1 capsid mutation, LEDGIN marks the usage of LEGFF/p75-IN interaction inhibitor, and LEDGF-KD transduction of cells in which LEDGF/p75 protein is knocked down. The right part of the bar plots represents IN mutants. Mutants of S119 are shown in blue, mutants of R231 in green, and mutant of both S119 and R231 in yellow. (G) Frequency of HIV-1 IS in Alu repeats. (H) Frequency of intra-Alu repeats in palindromic motif CT..G…C..AG. (I) Frequency of 10 most frequent sequence motifs.


