
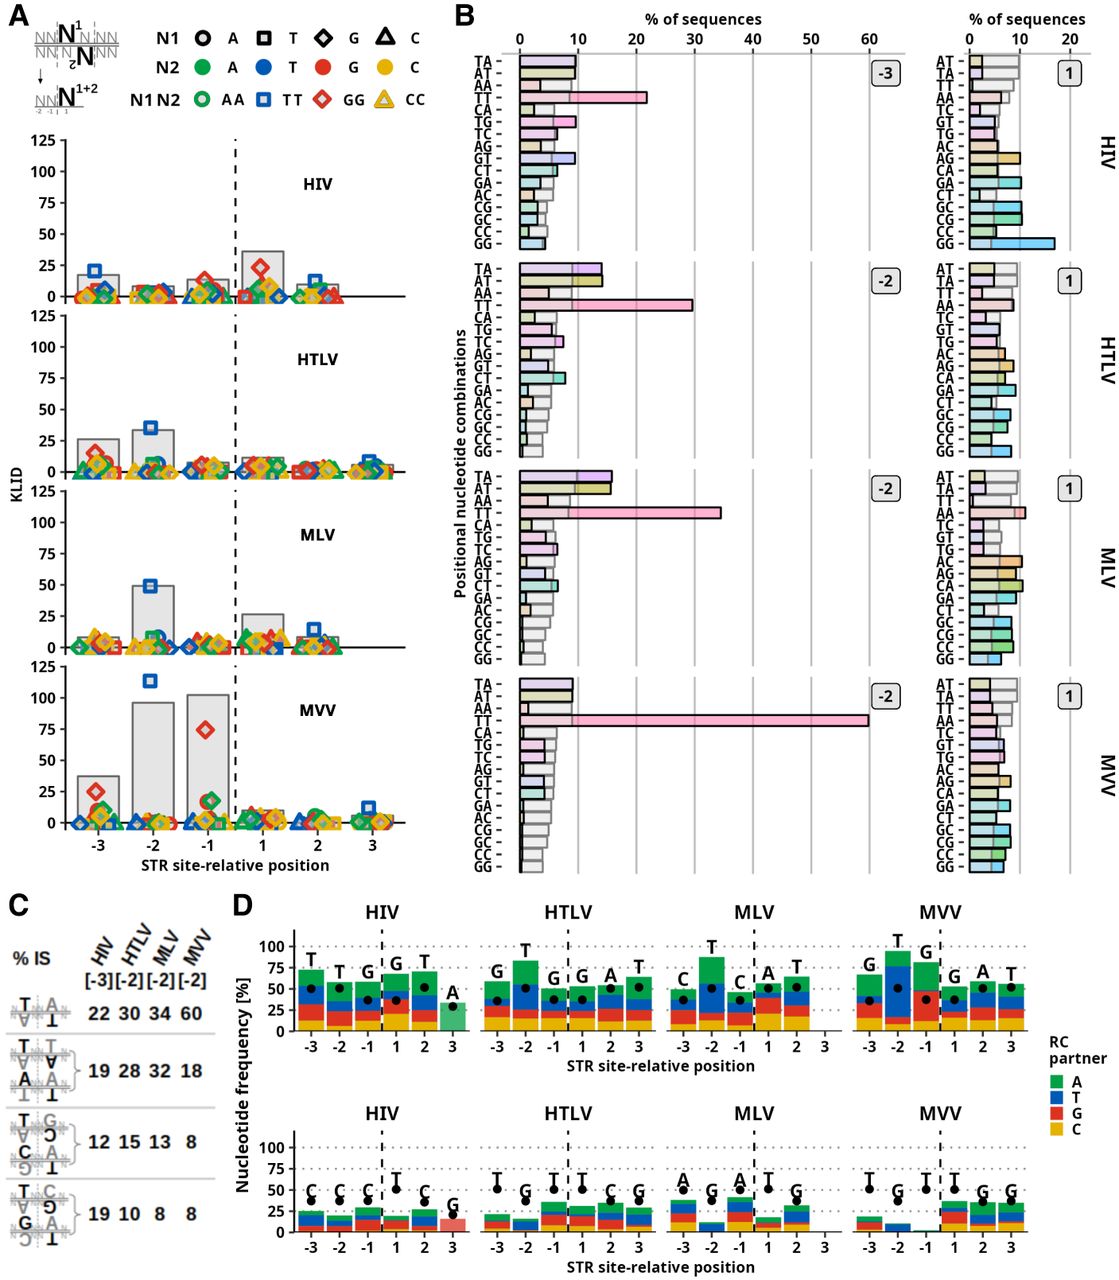
Preferred nucleotide combination at positions proximal to the cleavage site. Frequency of nucleotide combinations at complementary positions of both DNA strands. (A) KLID score of dinucleotide combinations at complementary sites marked by position relative to the cleavage site. The position of the cleavage site is marked by the vertical dashed line. Positions upstream to the cleavage site are marked with negative values. Gray bars represent the total KLID value at the position. Colored points represent individual contributions of each of the nucleotide combinations. Colors and shapes of points marking palindromic combinations are depicted in the legend. (B) Frequency of sequences with marked positional nucleotide combination. Gray bars represent the frequency observed in a control (random) set of sequences. The numbers to the right of the bars show the position relative to the cleavage site. The left column represents the positions with the maximum KLID score upstream of the cleavage site, and the right column represents the cleavage site–proximal position |1|. (C) Representation of frequency of T-containing dinucleotide combinations at position |−3| of HIV and position |−2| of HTLV, MLV, and MVV IS sequences. (D) Representation of frequencies of the most (top) and the least (bottom) frequent nucleotide at a given cleavage site–relative position. The height of the bar represents the marked nucleotide frequency, and the colored area of the bar represents the frequency of nucleotide present at complementary cleavage site–relative position (i.e., position with the same number but on opposite DNA strand). Black points represent the nucleotide frequency in the random set of sequences.


