
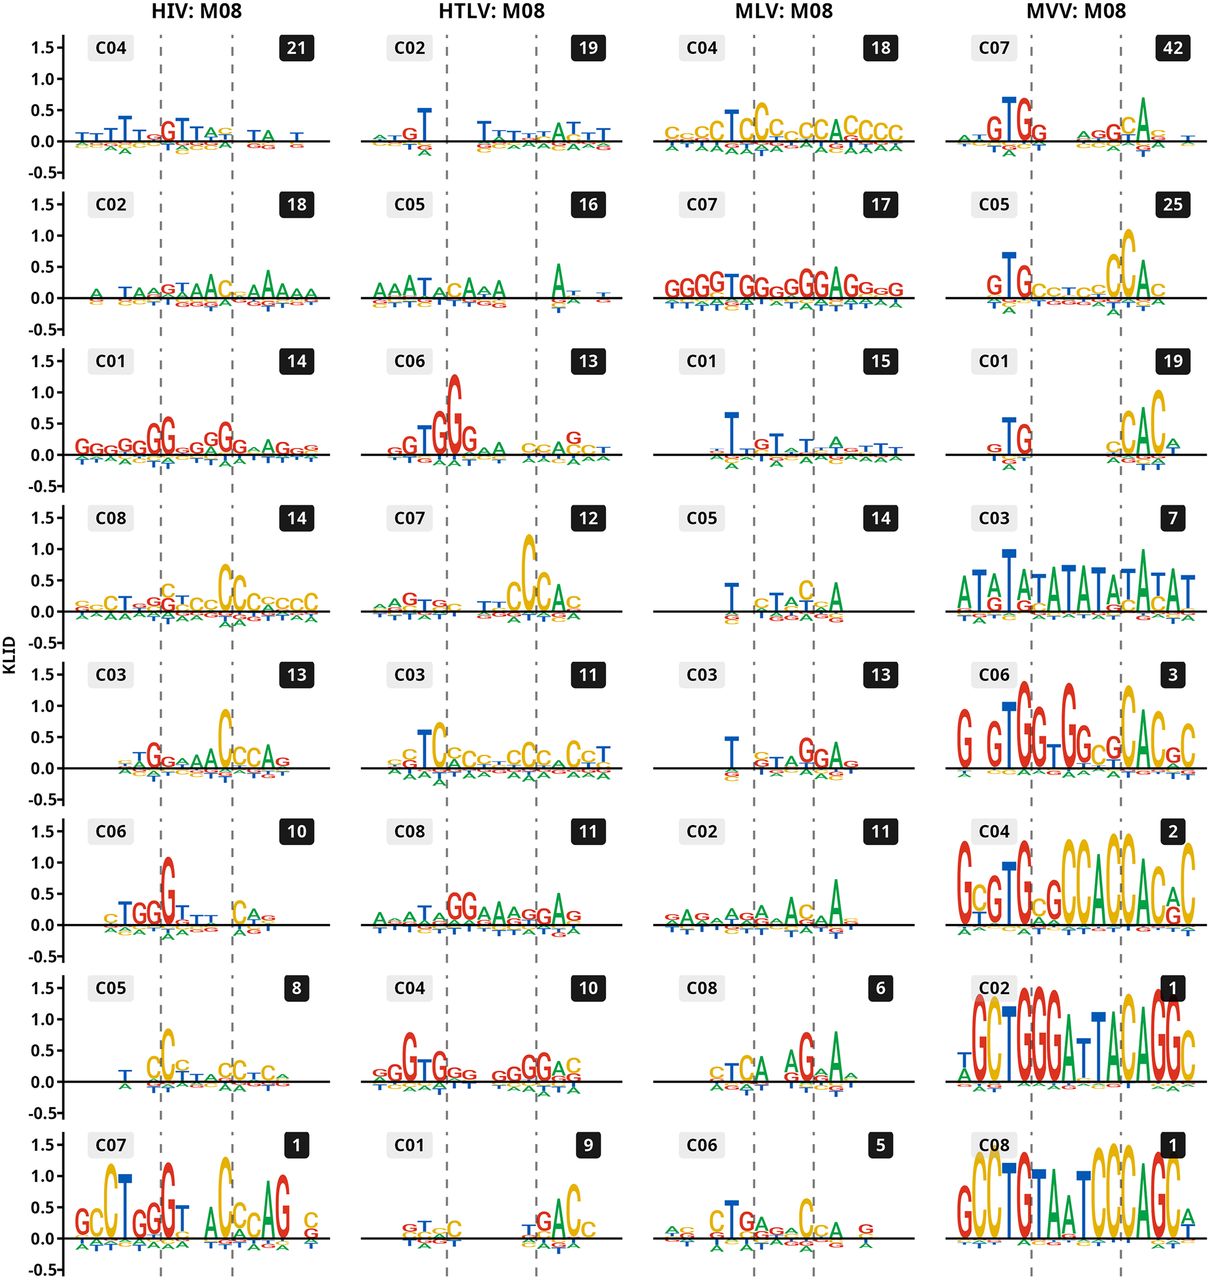
Sequence logo representations of the mixture model components of IS data sets. Eight-component (M08) mixtures of HIV, HTLV, MLV, and MVV IS sets are shown as examples of highly decomposed mixtures. KLID is used to construct the logos. Sequence logos of the two- to eight-component mixture models can be found in the Supplemental Sequence Logos file. Symbols in the gray field mark arbitrary component names as they appear in the output of the EM algorithm. Numbers in the black field mark the percentage of the mixture covered by the component. Logos represent IS sequences spanning 8 nt to each side from the center of the sequences. Vertical dashed lines mark sites where a strand transfer reaction takes place.


