
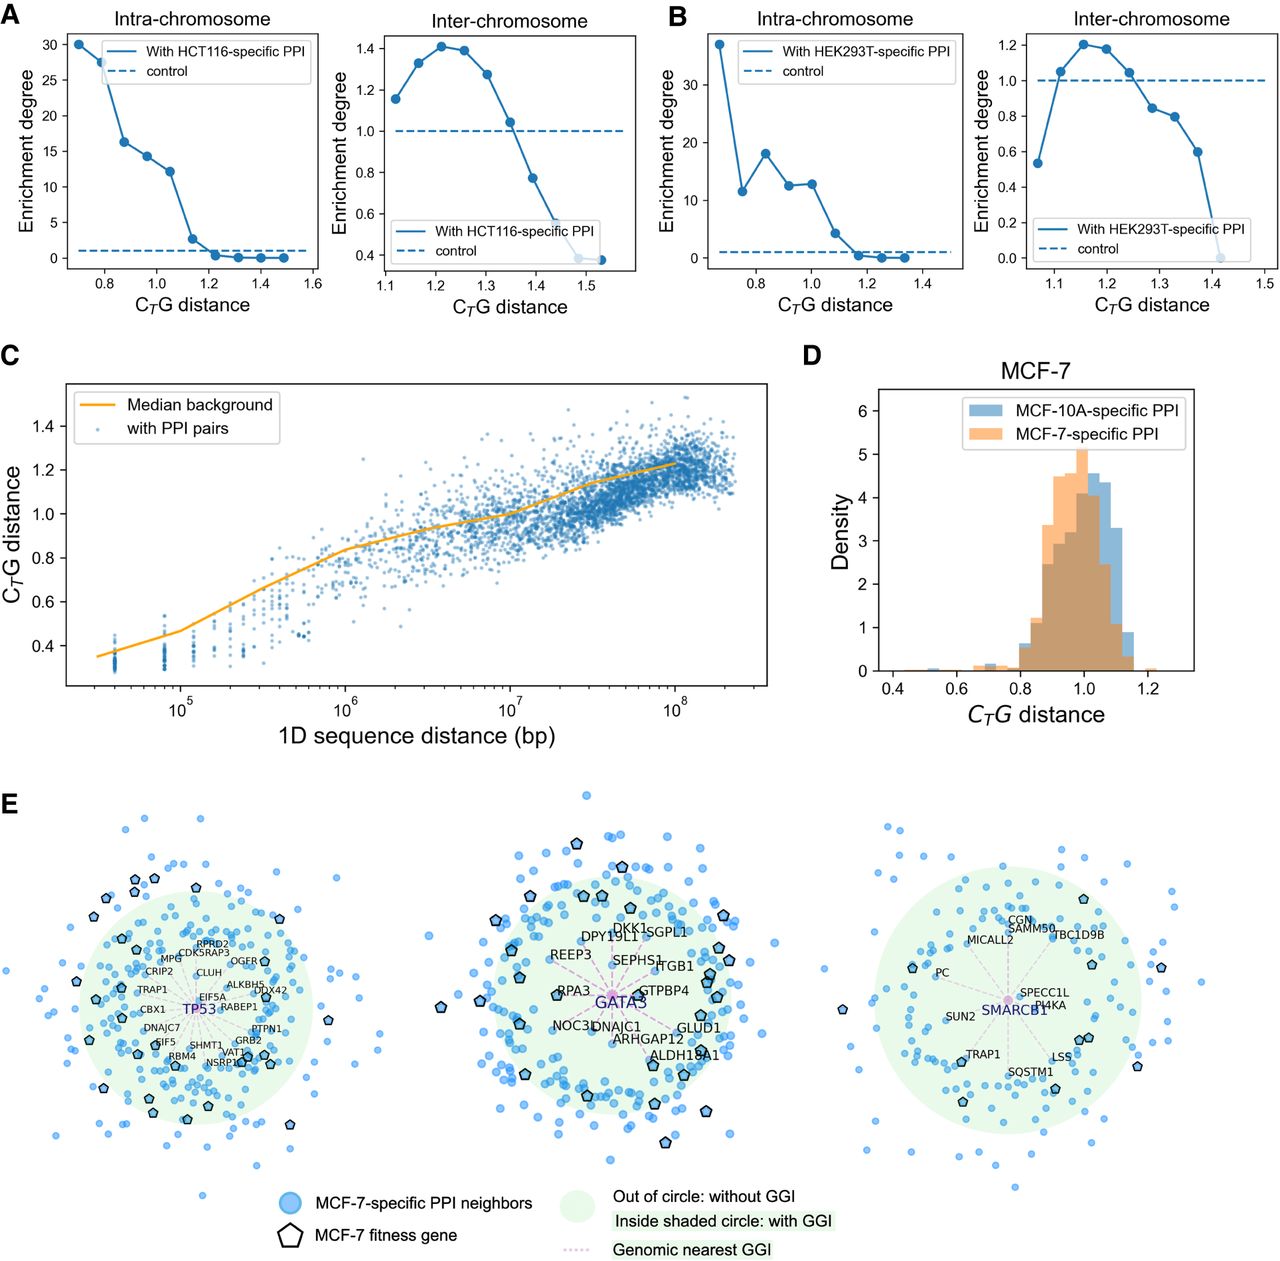
The tissue-specific correspondence of PPI and genomic proximity. (A) The proportion of intra-chromosomal (left) and inter-chromosomal (right) gene pairs with HCT116-related PPI at different CTG distances. The proportion refers to number of gene pairs with PPIs at fixed CTG distance/number of all gene pairs at fixed CTG distance. The background refers to number of gene pairs with PPIs/number of all gene pairs at all CTG distance. The enrichment degree refers to the proportion/background. The control is one. (B) The proportion of intra-chromosomal (left) and inter-chromosomal (right) gene pairs with HEK293T-related PPI at different CTG distances. (C) The CTG distance of gene pairs in fixed 1D genomic distance. The CTG distance between gene pairs with corresponding PPIs (blue scatters) is more proximal than the median CTG distance of all gene pairs at all 1D genomic sequence distance (orange line). (D) CTG distance of gene pairs with MCF-7-specific and MCF-10A-specific PPIs in MCF-7 cell. (E) TP53-, GATA3-, and SMARCB1-related MCF-7-specific PPIs. The distance to TP53 indicates the CTG distance; the green circle indicates the background distance, the pink scatter indicates MCF-7 fitness genes, and the dashes indicate genomic proximal neighbors.


