
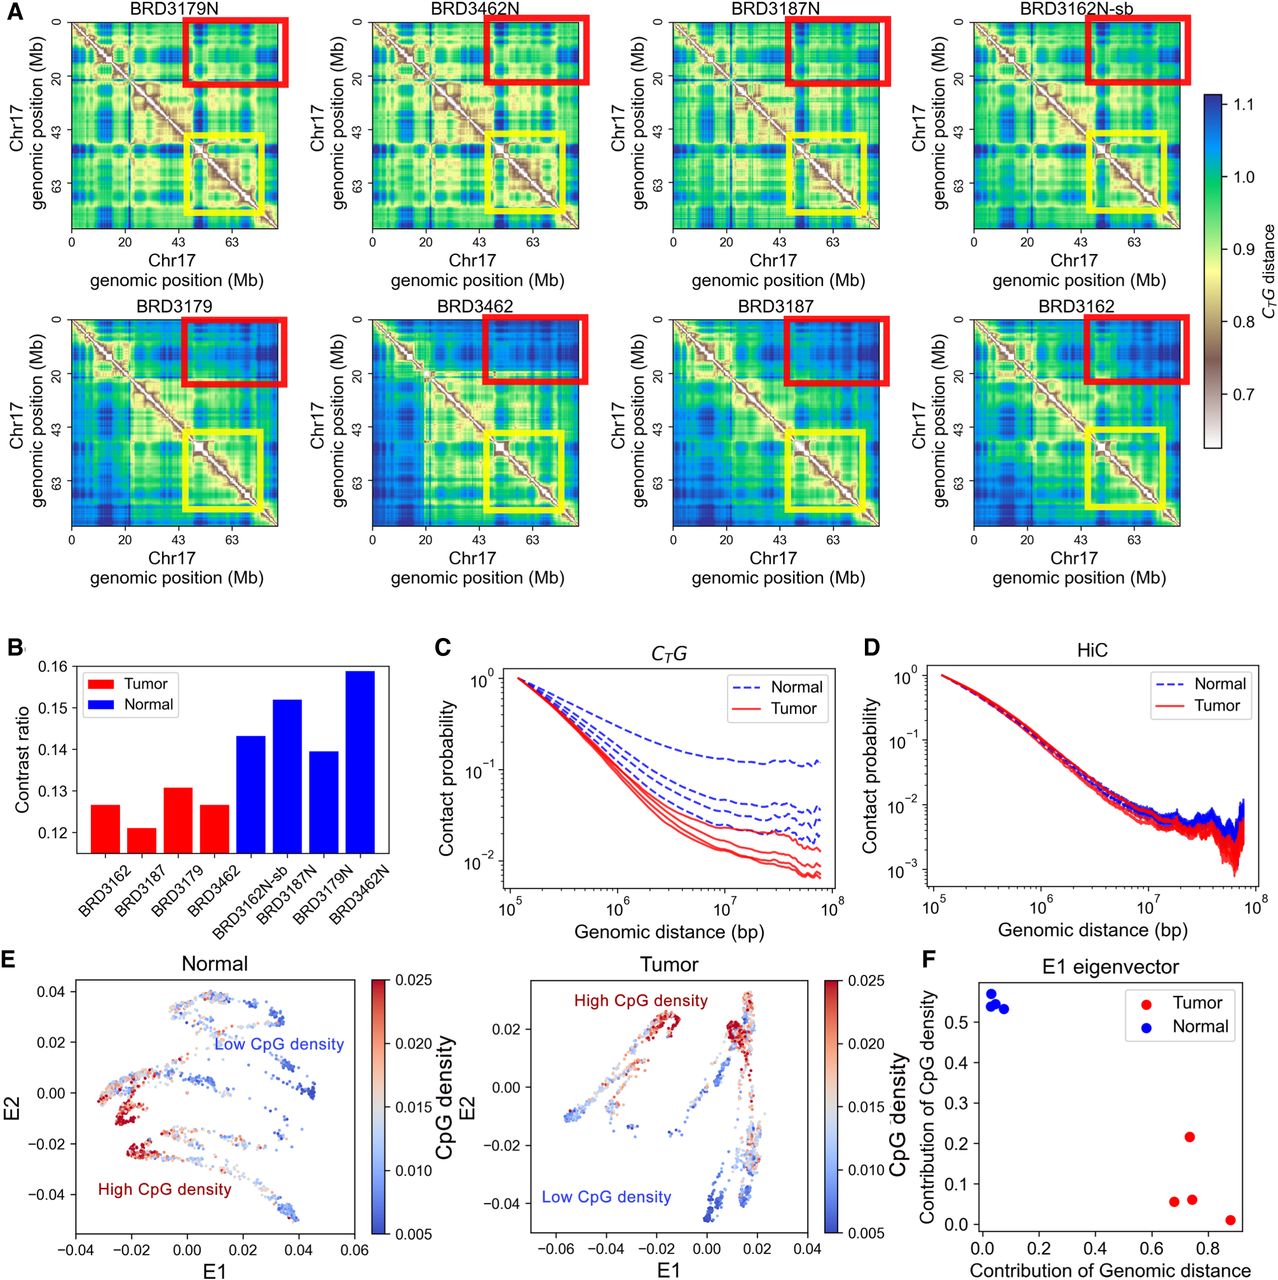
Global structural patterns of colorectal cancer revealed by CTG. (A) The CTG distance matrix for normal (top) and tumor (bottom) colon samples. Each column represents pairwise normal and tumor samples derived from the same patient. The yellow and red squares are examples of the differences between normal and tumor samples. (B) The contrast ratio of the CTG distance map; the blue bars correspond to normal samples, and the red bars correspond to tumor samples. (C) Contact probability as a function of genomic distance calculated from the CTG contact map. (D) Contact probability as a function of genomic distance calculated from the Hi-C contact map. (E) The 2D Laplacian eigenmaps of CTG distance matrices for pairwise colon normal and tumor samples. Each point represents a 40-kb genomic region. The color is used to represent the CpG density of the corresponding genomic region. (F) Contribution of sequence properties to structure-related E1 eigenvector.


