
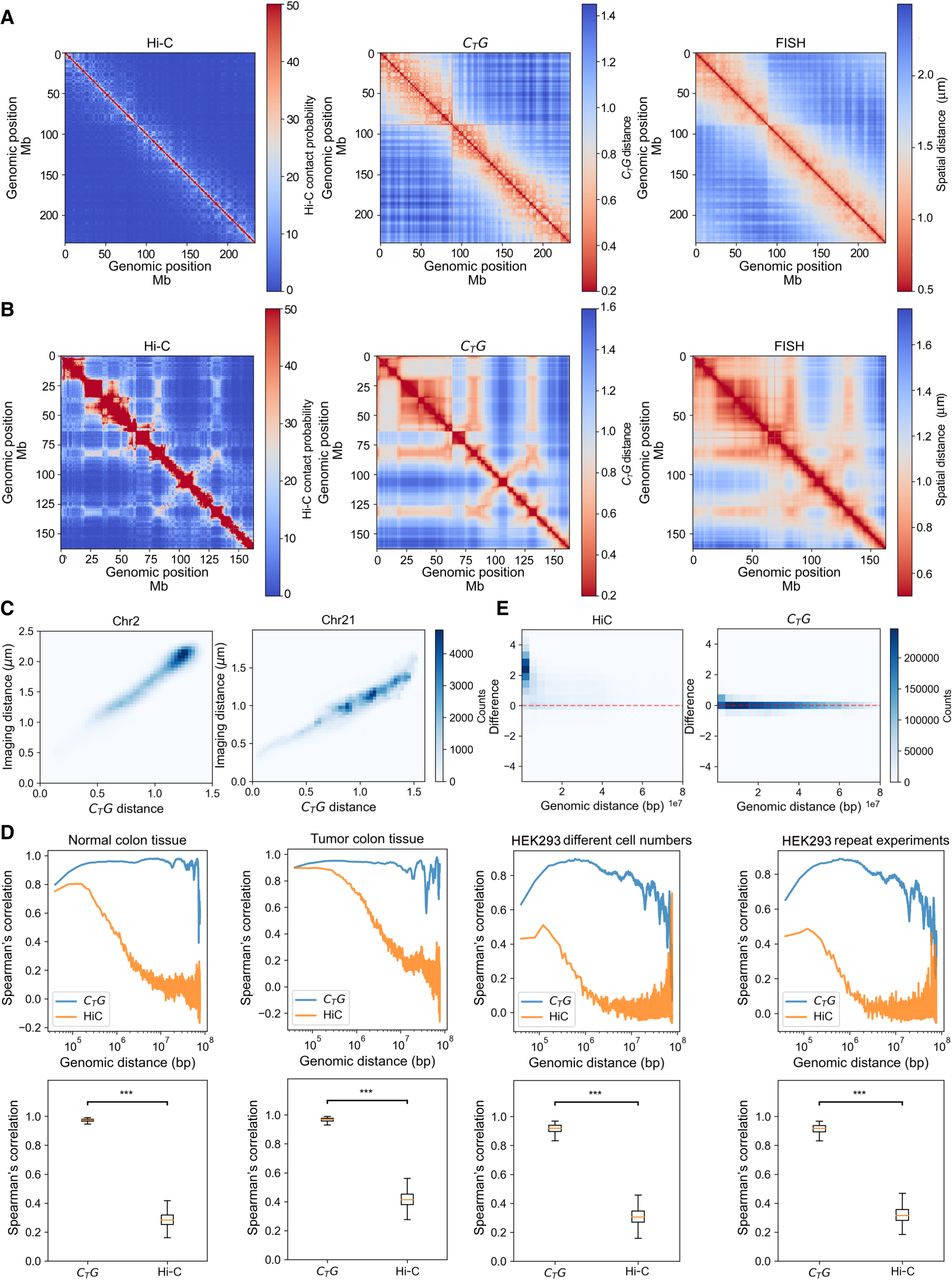
Validation of CTG. (A) The Hi-C contact matrix (left), CTG distance matrix (middle), and the median spatial distance matrix (right) of Chr 2 (resolution of 50 kb). (B) The Hi-C contact matrix (left), CTG distance matrix (middle), and the median spatial distance matrix (right) of Chr 21 (resolution of 50 kb). (C) The correlation between the CTG distance matrix and the median spatial distance matrix of Chr 2 and Chr 21. (D) The Spearman's correlation for the genomic sequence distance (top) and for the individual genomic region (bottom) between pairwise contact matrices derived from (1) normal colon tissue samples, (2) tumor colon tissue samples, (3) different numbers of 293 cells, and (4) repeated experiments on 293 cells. (***) P-value < 10−300 (t-test). (E) The MD plots between two normal colon tissue samples in view of genomic sequence distance.


