
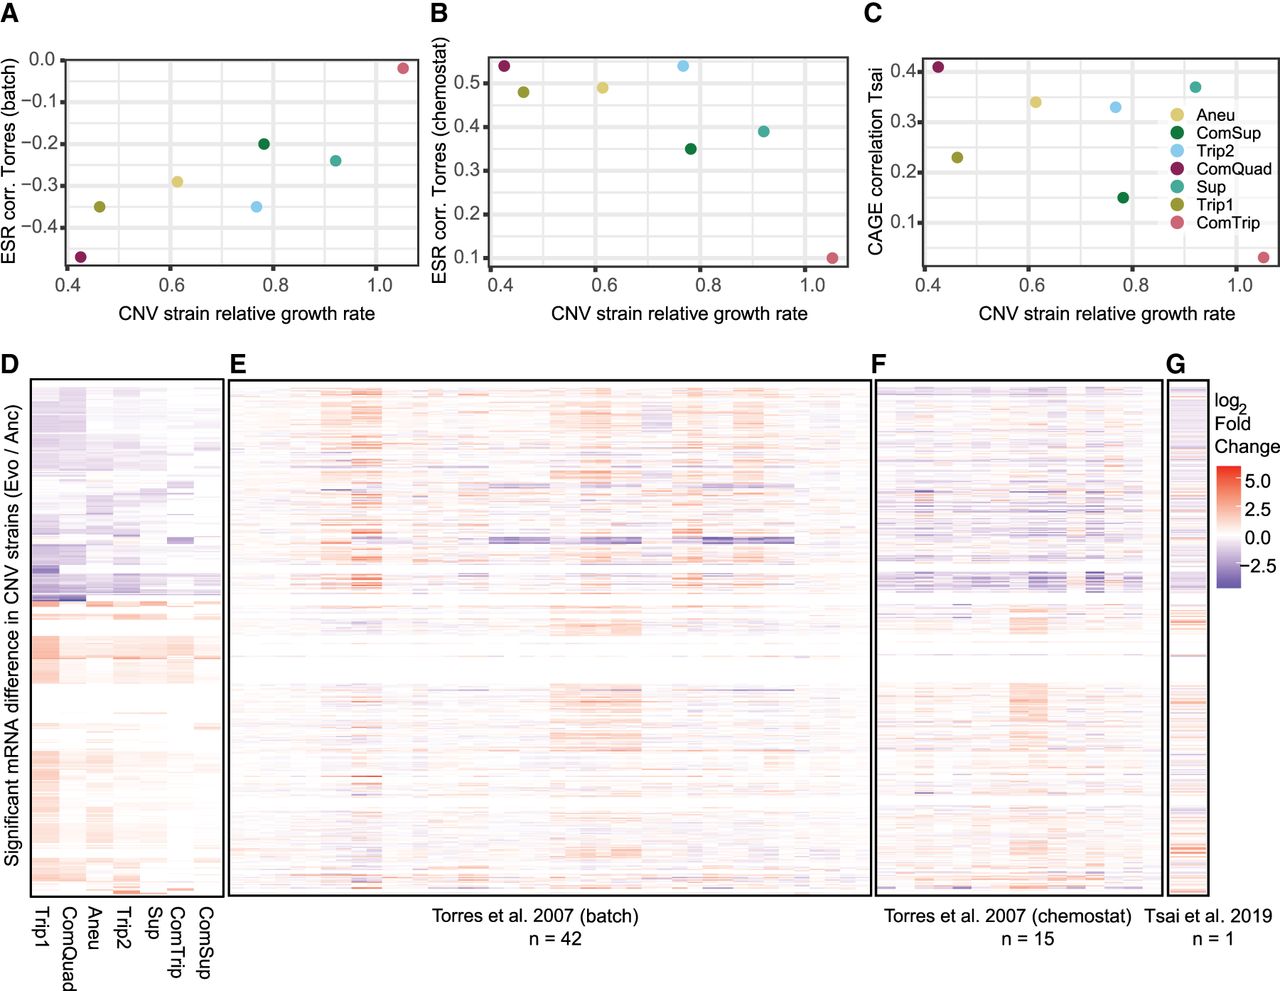
Global gene expression signatures in CNV strains in relation to aneuploidy signatures. Previous research has identified ESR-like signatures of gene expression using W303 aneuploid strains grown in batch (A) (Torres et al. 2007) and chemostat (B) (Torres et al. 2007) conditions. To evaluate how similar the CNV responses are to aneuploid responses, we calculated the mean log2 fold-change for all evolved strains relative to their ancestors. We used only the subset of ESR genes and calculated Pearson's correlation between the mean aneuploid expression and each of our CNV strains (vertical axis). Because ESR has previously been shown to correlate with growth rate (Torres et al. 2007), we then ordered these correlation values by the relative YPGal growth rates for each CNV strain (horizontal). Correlation with the CAGE signature (Tsai et al. 2019) identified in BY1747 aneuploid strains grown in rich media (C). Heatmaps for each data set show the log2 fold-change in expression for 436 genes (rows) that were significantly differentially expressed in at least one CNV strain in this study (D) and the expression of those genes of Torres et al. (2007) aneuploids in batch (E), Torres et al. (2007) aneuploids in chemostat (F), and Tsai et al. (2019) (G).


