
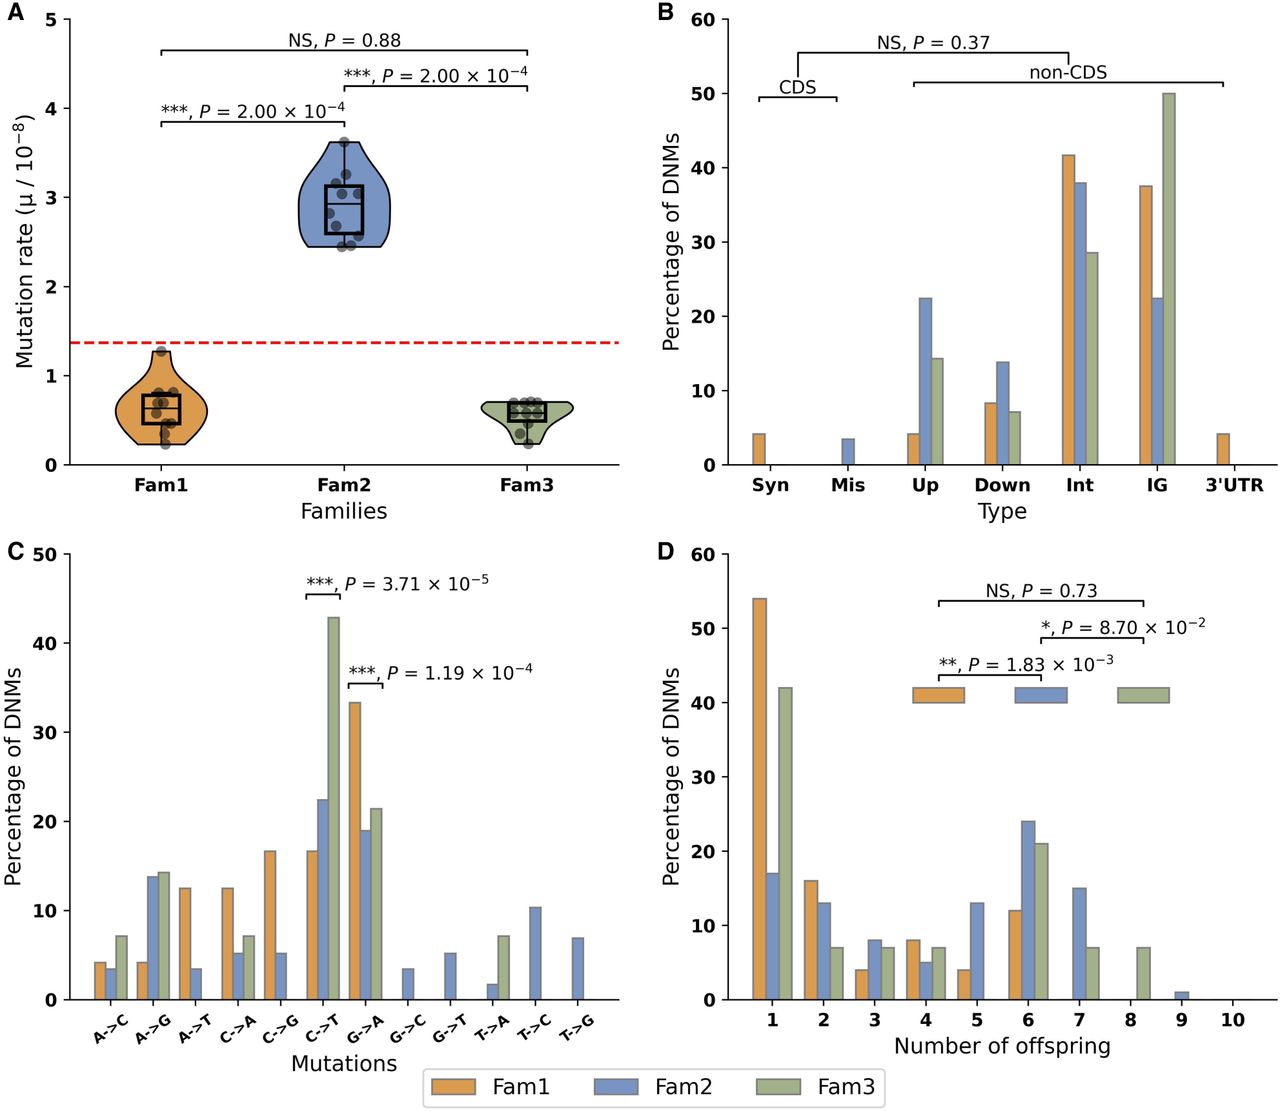
Summary statistics of DNMs in three guppy pedigrees. (A) Mutation rate in three families. Red line represents the average mutation rate across three families. Asterisks indicate statistical difference among families (Wilcoxon signed-rank test, [***] P < 0.001; NS: nonsignificant). Orange: Fam1; blue: Fam2; green: Fam3. (B) Functional distribution of DNMs. There was no statistical difference (Fisher's exact test, NS: nonsignificant) in the proportion of DNMs between coding sequences (CDS), including synonymous mutations (Syn) and missense mutations (Mis), and noncoding sequence (nonCDS), including upstream (Up), downstream (Down), intron (Int), intergenic (IG), and 3′ UTR variant (3′ UTR) once correcting for callable genome size. (C) Mutation spectrum. Asterisks on the top of each category indicate significant difference to other categories (χ2 test, [***] P < 0.001). (D) Shared mutations among siblings: 45.73%, 72.76%, and 57.14% of DNMs are shared by at least two siblings in Fam1, Fam2, and Fam3, respectively, likely reflecting mutations occurring during early germline development. DNMs observed in only a single offspring represent 54.17%, 17.24%, and 42.86% of all DNMs in Fam1, Fam 2, and Fam3, respectively, and these most likely represent mutations after the onset of gametogenesis (Goldmann et al. 2019). The relative proportion of DNMs in a single offspring and DNMs shared by multiple siblings in Fam2 is significantly different from other two families (χ2 test, [**] P < 0.01; [*] P < 0.1; NS: nonsignificant).


