
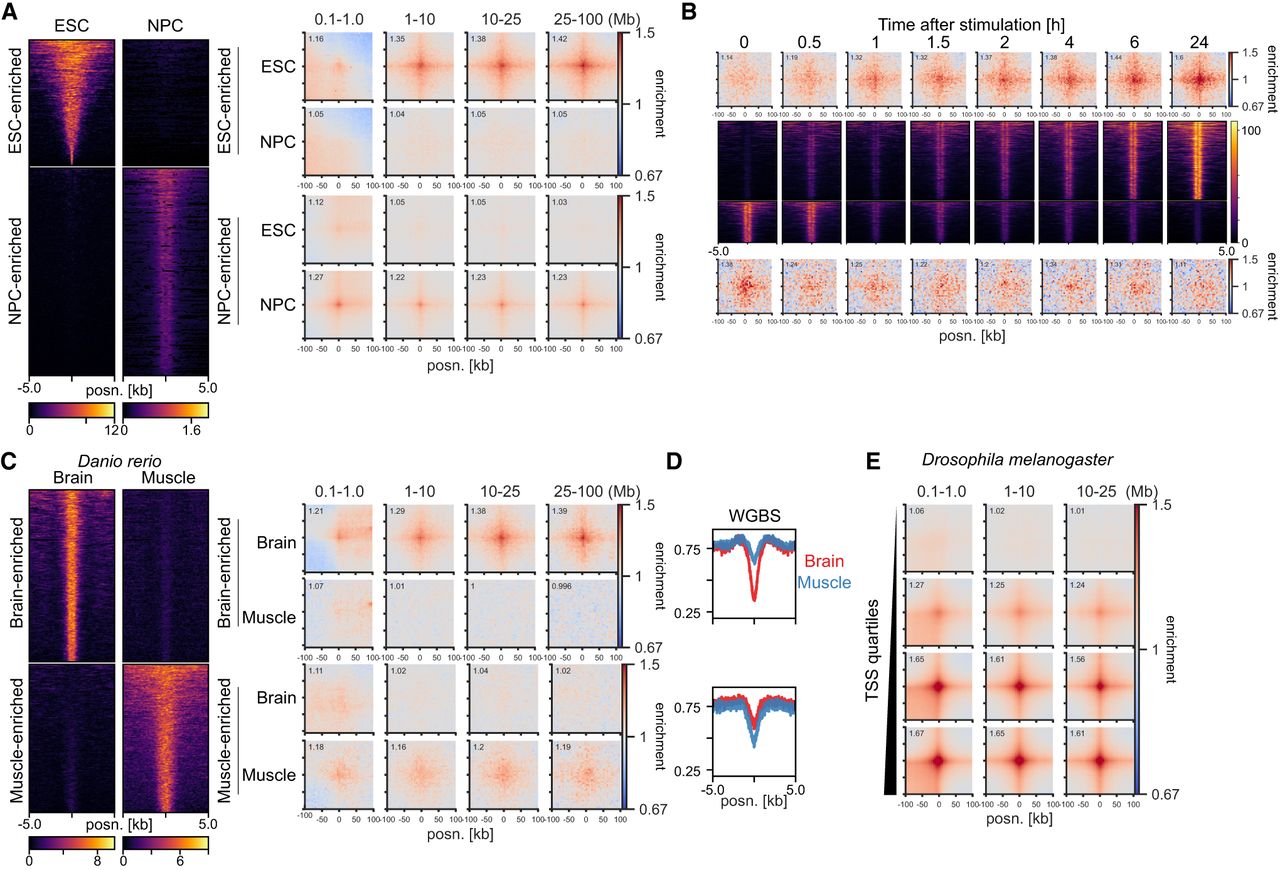
Interaction dynamics in mouse, human, zebrafish, and Drosophila melanogaster. (A, left) H3K27ac signal in mESCs and neural progenitor cells (NPCs) at mESC-enriched (1509 peaks) and NPC-enriched (2491 peaks) regions. (Right) Pileup analysis for the differentially enriched H3K27ac peaks in Hi-C from mESCs and NPCs. (B, top and bottom) Pileup analysis for regions with increasing (top; 1058 peaks) or decreasing (bottom; 553 peaks) H3K27ac across the time course of LPS and IFNG stimulation of THP-1-derived macrophages. (Middle) H3K27ac signal in THP1-derived macrophages at regions with increasing (top) or decreasing (bottom) H3K27ac. (C, left) H3K27ac signal in zebrafish brain and muscle at brain-enriched (2315 peaks) and muscle-enriched (1994 peaks) regions. (Right) Pileup analysis for the differentially enriched H3K27ac peaks in brain and muscle. (D) Average whole-genome bisulfite (WGBS) signal in the differentially enriched H3K27ac peaks in brain and muscle. (E) Pileup analysis for D. melanogaster TSSs (2943 regions per group), divided by expression level based on RNA-seq, in Hi-C data from D. melanogaster eye-antennal imaginal discs.


