
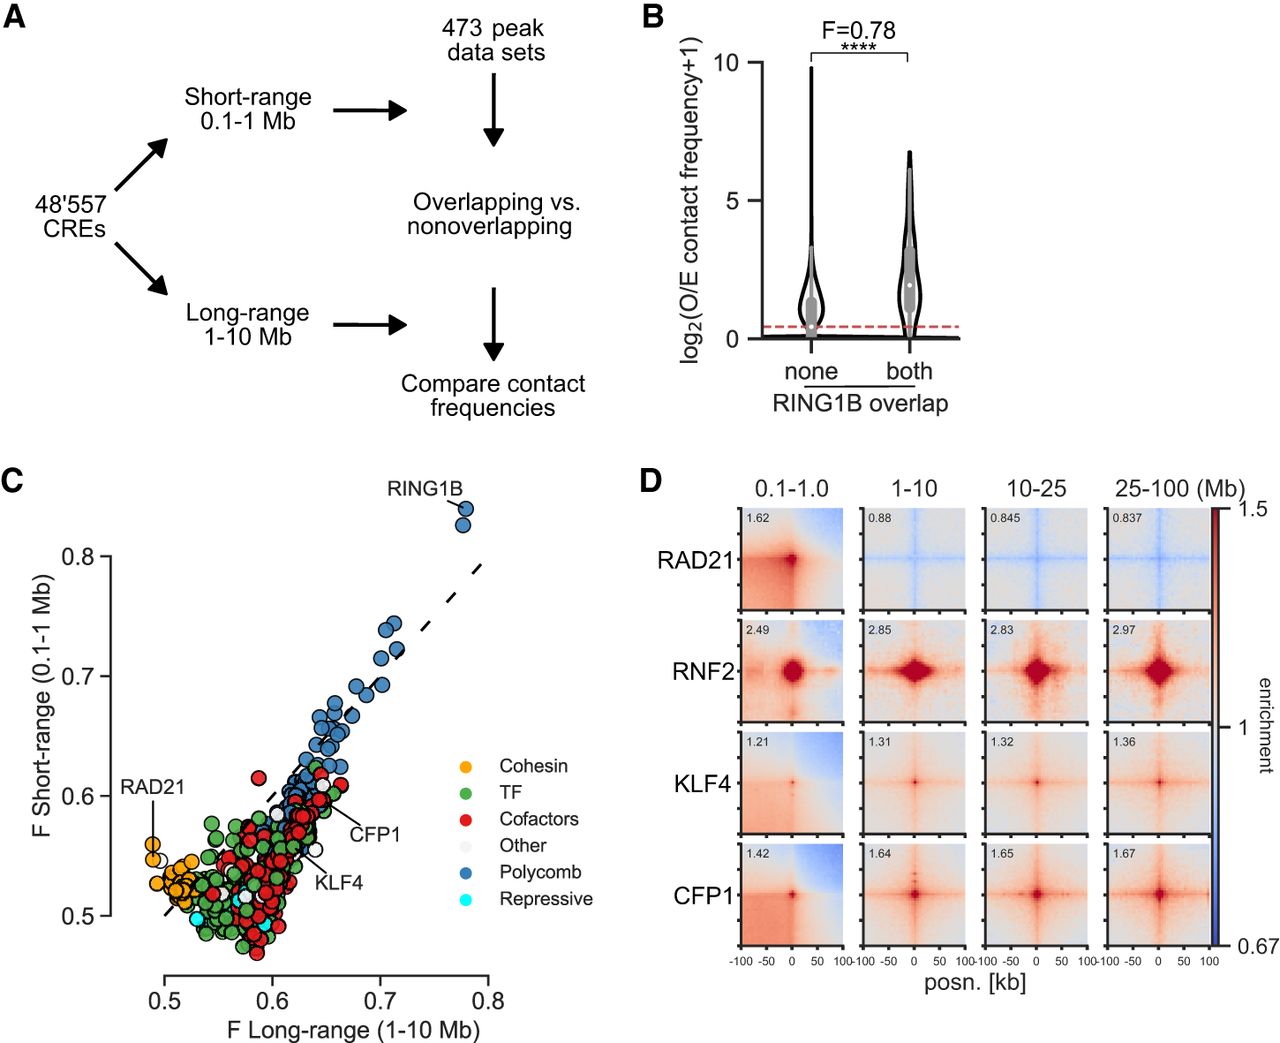
Computational screening for factors associated with enriched interactions between CREs. (A) Schematic of the computational pipeline. CRE pairs are split into short range (0.1–1 Mb between pairs) and long range (1–10 Mb between pairs). These regions are overlapped with peaks from different data sets and contact frequencies at 10-kb resolution compared between pairs overlapped by the factor and between pairs not overlapped by the factor to calculate enrichment values. (B) Example of the analysis for a RING1B ChIP-seq data set. Observed over expected (O/E) contact frequencies for CREs at long range were split into overlapping RING1B peaks on neither or both sides, and Mann–Whitney F and adjusted P-values were calculated: (****) P = 3.8 × 10−184. (C) Effect sizes for factors with significantly enriched chromatin interactions compared with unbound CREs in mESCs. The x- and y-axes show enrichment at short range and long range. Colors represent the group to which the factor belongs. (D) Pileup analysis for 5000 regions for each of the indicated hits from C for interaction pairs at different distances of genomic separation in Micro-C data from mESCs. For CFP1 and KLF4, peaks overlapping RING1B binding sites were excluded.


