
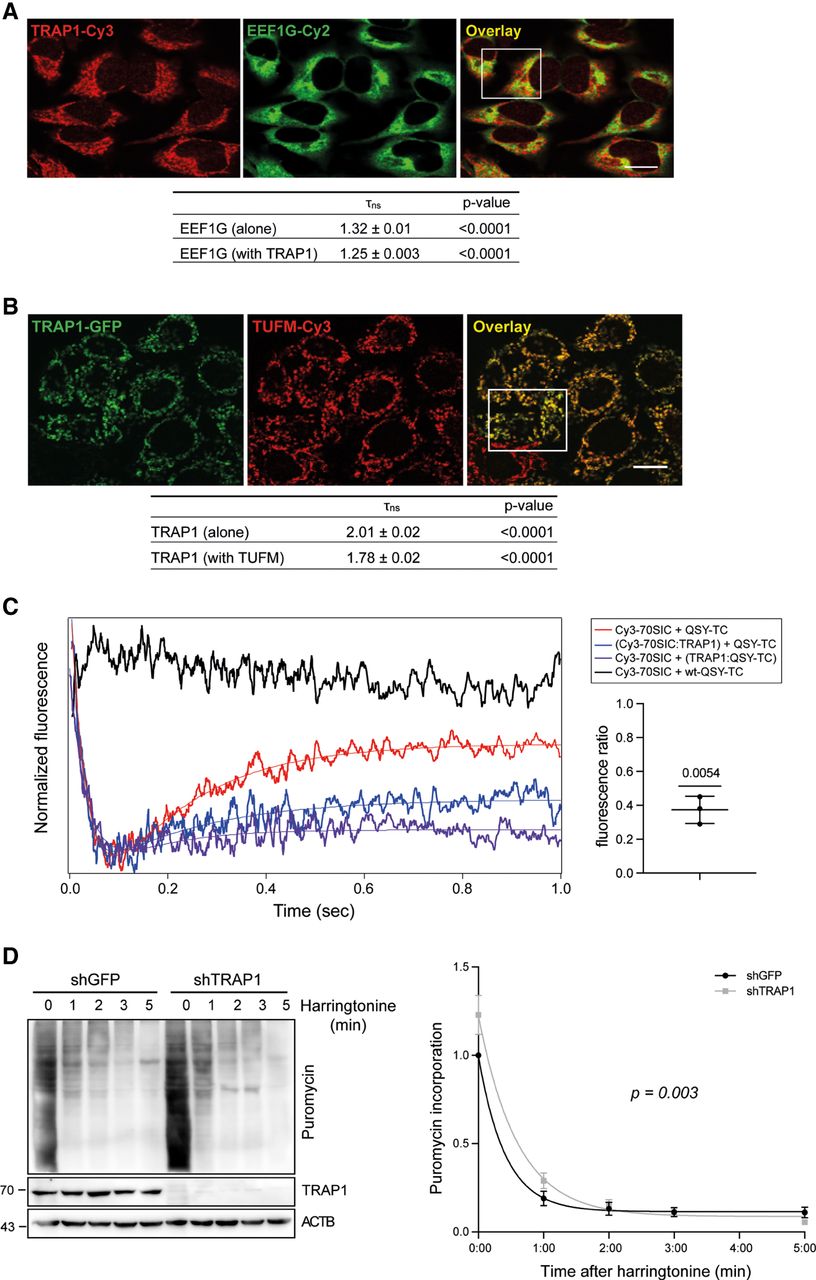
TRAP1 binds both cytosolic and mitochondrial translation elongation factors and slows down elongation rate. (A) Fluorescent confocal microscopy analysis of TRAP1-Cy3 (acceptor) and EEF1G-Cy2 (donor) in HeLa cells. Dipole–dipole energy transfer from the fluorescent donor to the fluorescent acceptor allowed calculating FRET efficiency (EFRET %) as described in the Methods section. The overlay images show the inset area in which FRET has been analyzed. Scale bar, 10 µm. τns values are expressed as mean ± SEM. The two-tailed P-value represents the statistical significance based on the Student's t-test. (B) Fluorescent confocal microscopy analysis of TRAP1–GFP (donor) and TUFM-Cy3 (acceptor) in TRAP1–GFP-inducible HeLa cells. Dipole–dipole energy transfer from the fluorescent donor to the fluorescent acceptor allowed calculating FRET efficiency (EFRET %) as described in the Methods section. The overlay images show the inset area in which FRET has been analyzed. Scale bar, 10 µm. τns values are expressed. (C) TRAP1 inhibits EF-Tu release from the 70S initiation complex (70SIC) in stopped-flow assays. TRAP1 recombinant protein was preincubated with a ternary complex (TC) in which EF-Tu is labeled with the QSY9 fluorescence quencher (QSY-TC; purple trace), and the resulting solution was rapidly mixed with a Cy3-labeled 70S initiation complex (Cy3-70SIC; blue trace). The change in Cy3 fluorescence was monitored using a stopped-flow fluorometer. Upon entering in the A site, the quencher-labeled EF-Tu decreases the Cy3-labeled ribosome fluorescence, whereas its dissociation from the ribosome allows Cy3 fluorescence recovery. Black trace indicates negative control; red trace, positive control. The graph on the right shows the ratio of fluorescence increase in the presence of added TRAP1 to the fluorescence increase in the absence of TRAP1 in three independent experiments. The P-value represent the statistical significance based on the one-sample t-test. (D) Seventy-two hours after tet-induction shGFP-directed (control) or TRAP1-directed shRNAs, HeLa cells were treated with harringtonine (2 µg/mL) for the indicated times (0, 1, 2, 3, and 5 min) and subsequently treated with puromycin (10 μg/mL) for 10 min. Cells were lysed and subjected to immunoblotting with antipuromycin antibody. The graph shows densitometric intensity of the puromycin labeling, normalized on the total protein content (quantified by no-stain labeling; see Methods). Data are represented as mean ± SEM from eight independent experiments, with trend lines showing exponential one-phase decay analysis. P-value on the graph represents the statistical significance based on the extra sum-of-squares F-test.


