
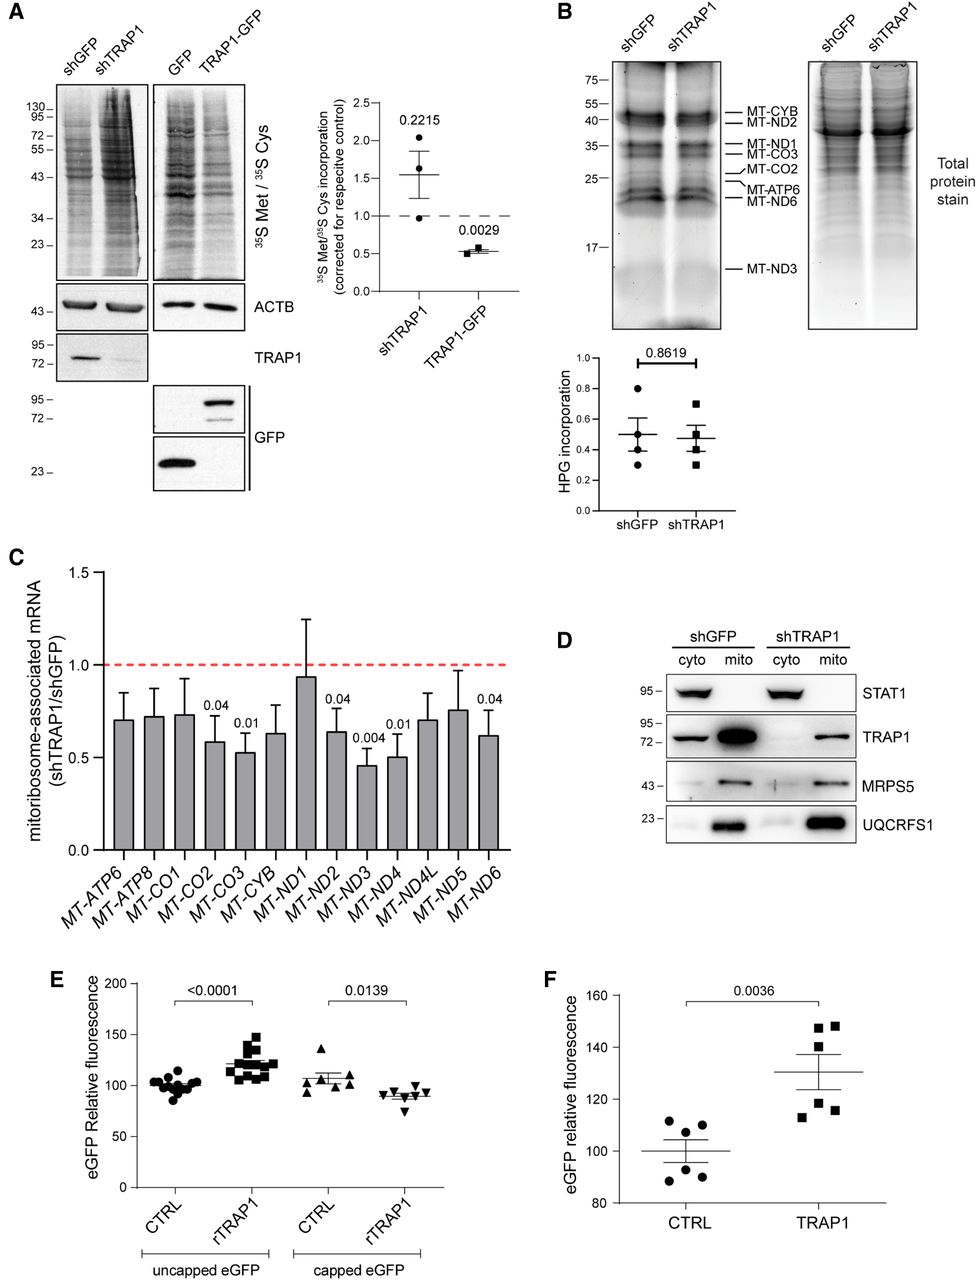
TRAP1 expression has opposite effects on total cell versus mitochondrial mRNA translation. (A) Representative autoradiography of total lysates from cells labeled with 35S Met/35S Cys, following tetracycline-induced induction of TRAP1-directed shRNA and control shRNA (72-h) cells or of TRAP1–GFP and unfused control GFP (24-h) cells, with relative densitometric band intensities and analysis (right). The P-values in the graph indicate the statistical significance based on the Student's t-test (n = 3). (B) Mito-FUNCAT-gel. Expression of GFP (control)-directed and TRAP1-directed shRNAs was induced in HeLa cells with tetracycline 72 h before labeling with 100 µM HPG-alkyne for 2 h. The resulting lysates were subjected to a click reaction with a TAMRA-azide, loaded for SDS-PAGE, and detected at 550 nm. (C) RT-qPCR performed on RNAs extracted from mitoribosomal fractions (4–11) isolated from HeLa cells 72 h after induction of shGFP/shTRAP1. The amount of mitoribosome-associated mRNA in the two samples has been normalized on 12S rRNA and corrected for its total expression level. Data are expressed as mean ±SEM (n = 5). Numbers above bars represent the statistical significance (P-value) based on the one-sample t-test. (D) Subcellular fractionation of HeLa cells showing the presence of indicated proteins into cytosolic (cyto) and mitochondrial (mito) fractions. (E) eGFP in vitro translation using wheat germ extracts. eGFP mRNA was added to reactions at a final concentration of 21.95 ng/μL. Where indicated, 0.3 μg/μL of TRAP1 recombinant protein (rTRAP1) was added to the reaction. Data are expressed as mean ± SEM (n = 14 for the translation of uncapped eGFP mRNA; n = 7 for the translation of capped eGFP mRNA). The two-tailed P-value represents the statistical significance based on the Student's t-test. (F) eGFP in vitro translation using E. coli extracts. eGFP mRNA was added to reactions at a final concentration of 21.95 ng/μL. Where indicated, 0.2 μg/uL of TRAP1 recombinant protein was added to the reaction. Data are expressed as mean ± SEM (n = 6). The P-value represents the statistical significance based on the Student's t-test.


