
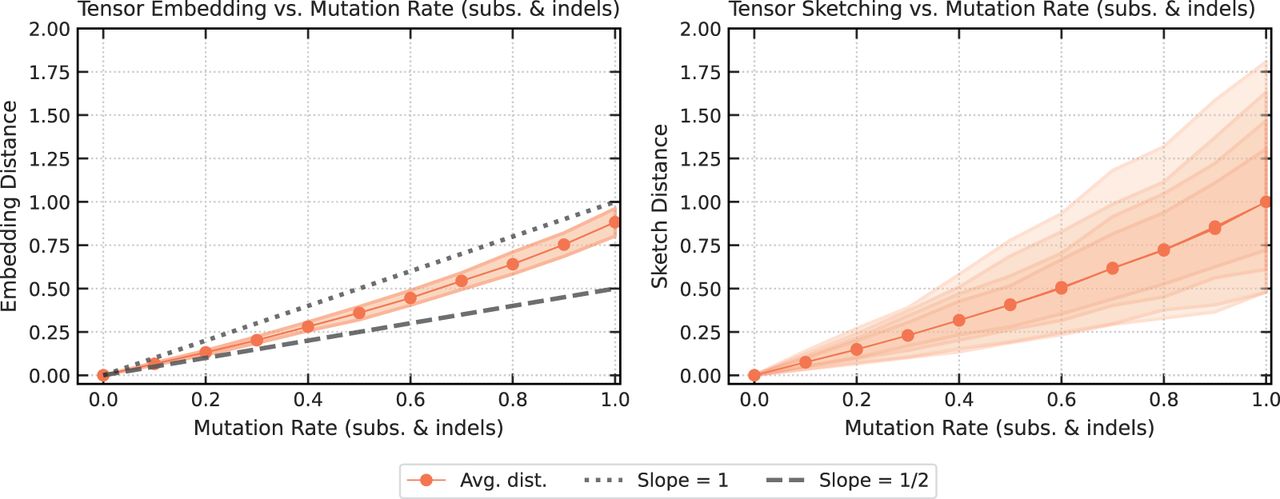
Comparison of expected distances for tensor embedding (left) and tensor sketching (right) as a function of the substitution, insertion, and deletion mutation rate, with each mutation type having probability  . The solid trace and shaded region show the mean and confidence interval, respectively, computed similarly to Figure 6, for sequences of length n = 1000. (Left) The solid trace shows the mean tensor embedding distance with t = 3, and the two dashed traces show the mean is between 1 and 1/2 slopes. (Right) The solid trace shows the mean tensor sketch distance with t = 3 and D = 8, 16, 32, 64. The shaded regions correspond to increasing values of D, with the lightest shade corresponding to D = 8 and the darkest to D = 64.


