
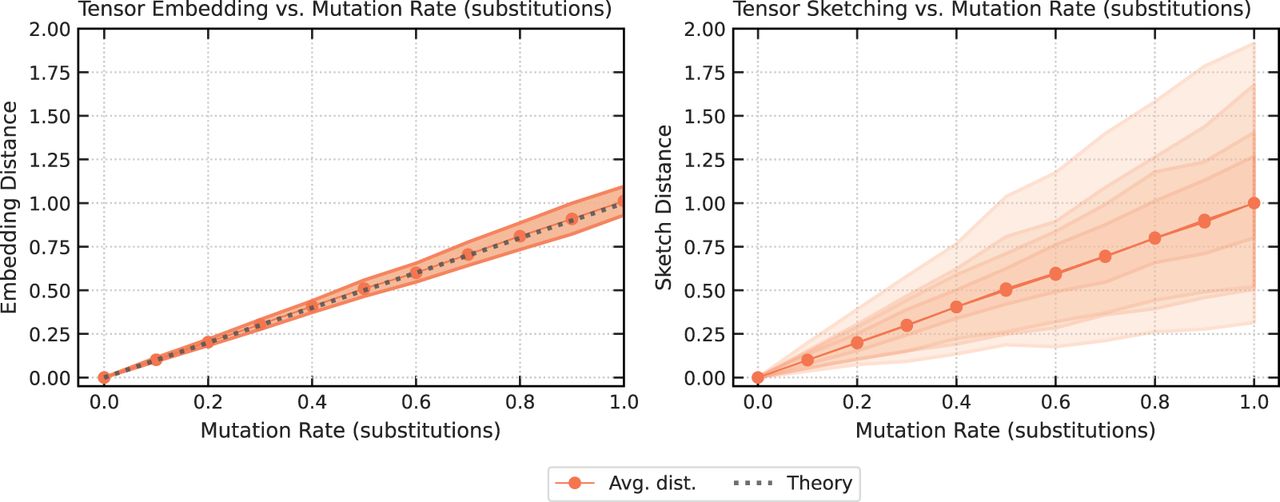
Comparison of expected distances for tensor embedding (left) and tensor sketching (right) as a function of the substitution mutation rate, for sequences of length n = 1000. Each data point is computed using 100 independent sequence pairs, and the process is repeated 100 times to compute the mean shown as the solid trace and the confidence interval shown as the shaded region, which covers the 5% − 95% range of the results. (Left) The solid trace shows the mean tensor embedding distance with t = 3, and the dashed trace shows the theoretical lower bound from Lemma 1. (Right) The solid trace shows the mean tensor sketch distance with t = 3 and D = 8, 16, 32, 64. The shaded regions correspond to increasing values of D, with the lightest shade corresponding to D = 8 and the darkest to D = 64.


