
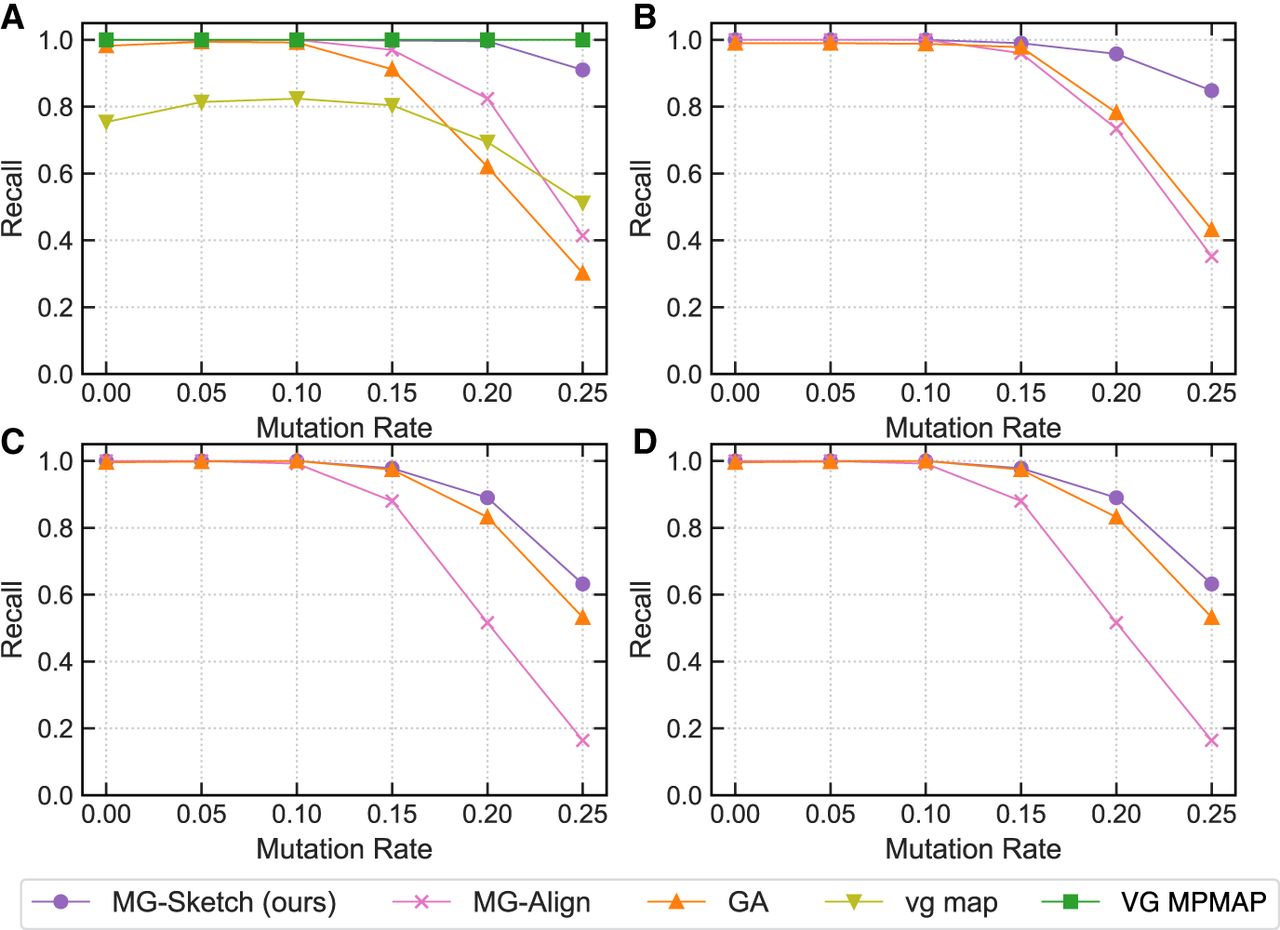
Figure 4.
Recall achieved across different mutation rates with increasing graph sizes for each baseline. The number of nodes in the graph for each plot is 100,000 (A), 10 million (B), 100 million (C), and 1 billion (D). Values are measured on the de Bruijn graph generated by MetaGraph. We run MG-Sketch with K = 40 neighbors and D = 14, w = 16, s = 8, t = 6. Query generation follows the same approach as explained in the section “Synthetic data generation,” with the mutation rates 0%, 5%, 10%, 15%, 20%, and 25%.


