
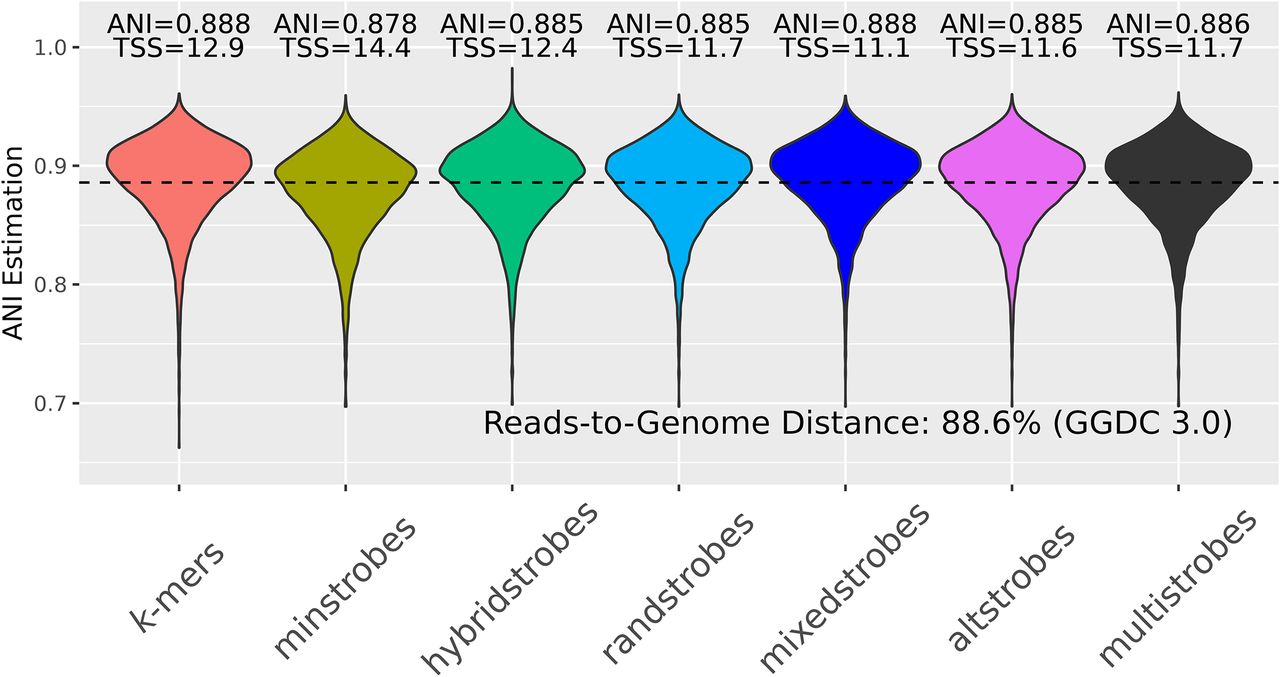
Figure 7.
ANI estimation as estimated by Adjusted Mash distance (Methods) between E. coli ONT reads and a E. coli genome (assembly GCA 003018575.1 ASM301857v1) with k-mers, spaced k-mers, minstrobes, hybridstrobes, randstrobes (2,15,25,50), mixedstrobes (2,15,25,50,0.8), altstrobes (2,10,20,25,50), and multistrobes (2,5,25,25,50). For each method, the square of the Pearson correlation coefficient (R2, lower is better) and the TSS (lower is better) between ANI estimation and true mutation rate is given. The ANI was compared to the reads-to-genome distance (88.6%) obtained from GGDC 3.0 with default settings (Meier-Kolthoff et al. 2013, 2022) using the TSS.


