
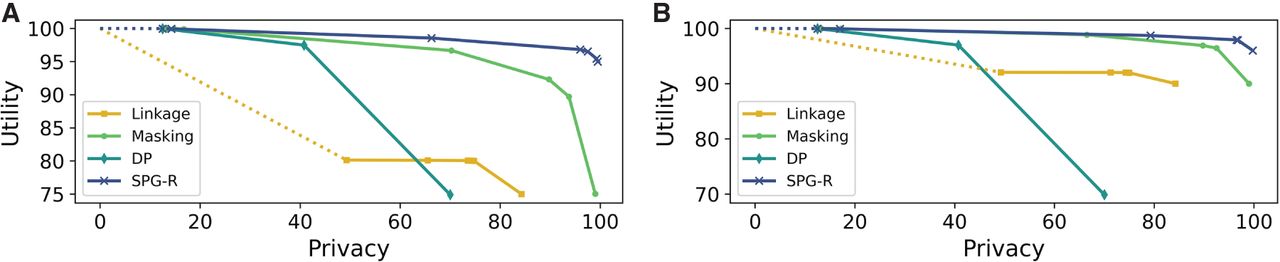
Figure 4.
Utility–privacy plots for the adaptive threshold attack model for AAF releases, compared with baselines. (A) K = 10, α = 0.75. (B) K = 10, α = 0.9.
(Downloading may take up to 30 seconds. If the slide opens in your browser, select File -> Save As to save it.)
Click on image to view larger version.
Utility–privacy plots for the adaptive threshold attack model for AAF releases, compared with baselines. (A) K = 10, α = 0.75. (B) K = 10, α = 0.9.
 CiteULike
 Delicious
 Digg
Digg Facebook
 Google+
 Reddit
 Twitter
