
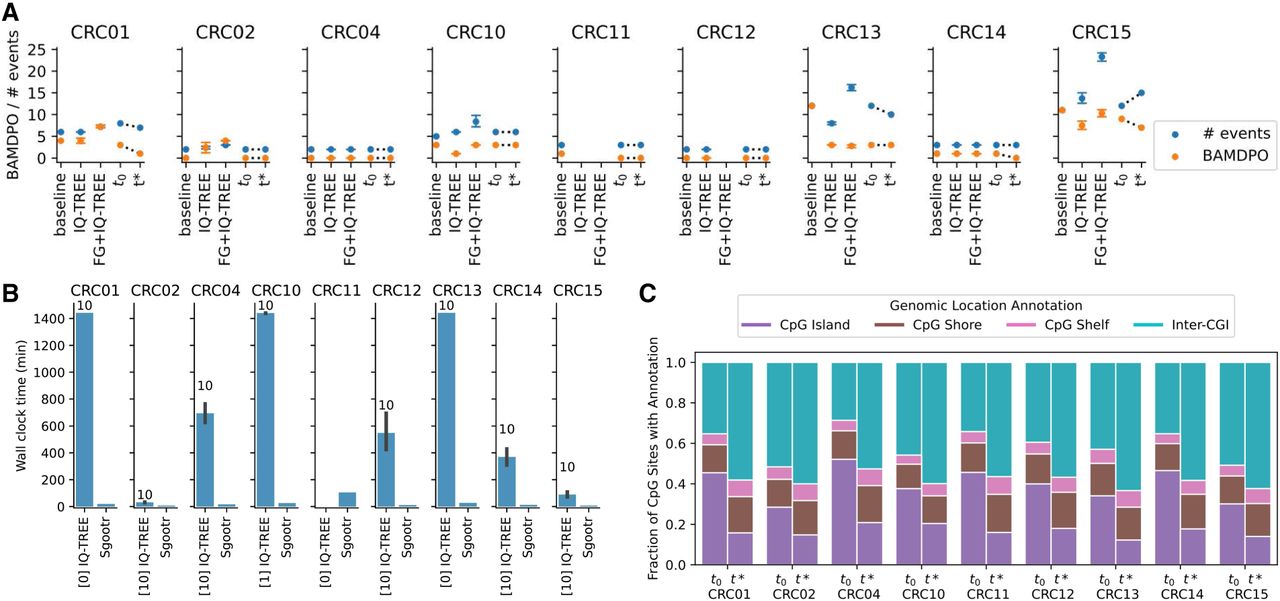
Overview of results from the Bian et al. (2018) metastatic CRC cohort. (A) Number of migration events and BAMDPO values of migration histories obtained via (1) naive baseline method, (2) IQ-TREE, (3) IQ-TREE on FG-selected CpG sites, (4) Sgootr intermediate tree before iterative procedure (t0), and (5) final tree output by Sgootr (t*). The IQ-TREE result is represented by the mean across 10 runs with different random seeds, with the error bars denoting the 95% confidence interval of the mean. The lack of data points in the “IQ-TREE” columns means IQ-TREE failed to finish the model optimization to start tree search after 24 h, and that in “FG + IQ-TREE” columns means FG analysis fail to terminate after 100 h. (B) Run time comparison between Sgootr and IQ-TREE. Each experiment is performed on four cores. The number in brackets next to “IQ-TREE” on the x-axis represents the number of IQ-TREE runs (out of 10) that have converged within 24 h. The number above each IQ-TREE bar represents the total number of runs (out of 10) with any tree search output (converged or intermediate after 24 h) and, hence, contributes to the run time and migration history comparison. (C) Fraction of CpG sites located in CpG island, CpG shore, CpG shelf, and inter-CGI regions before (t0) and after (t*) the iterative pruning component of Sgootr.


