
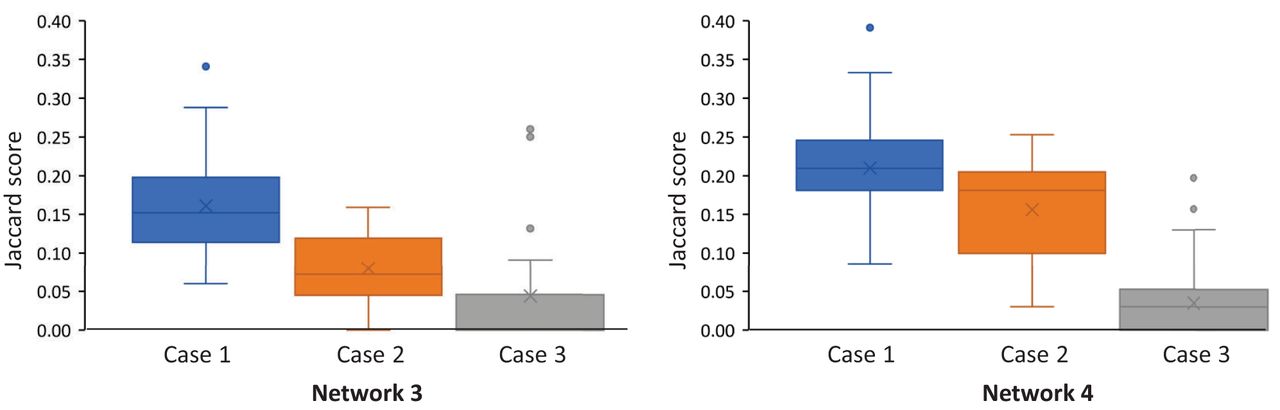
Figure 6.
The box and whisker plots for the Jaccard scores for the original networks (Supplemental Fig. S4) and ones inferred using ALTS in three cases. In each plot, the three bars from left to right summarize the 50 Jaccard scores obtained using five random inferred trees (Case 1), using five random inferred trees that appeared six or more times in the list of all 2000 inferred trees (Case 2), and using the “true” gene trees (Case 3) sampled from the networks.


