
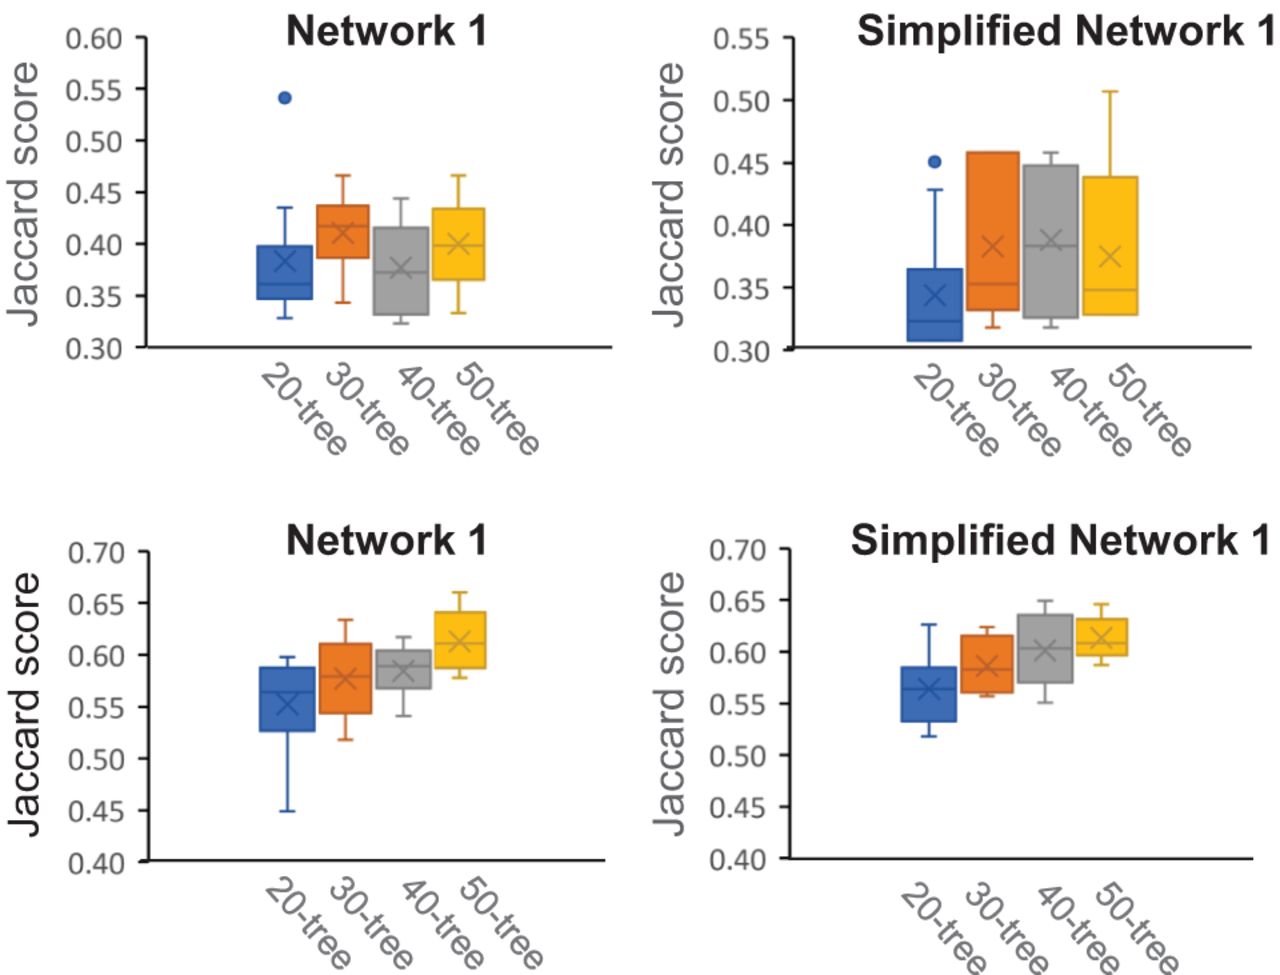
Figure 5.
The box and whisker plots for the Jaccard scores for the original networks (Supplemental Figs. S1, S2) and ones inferred by ALTS in four cases. In each plot, the four bars from left to right summarize the Jaccard scores for the original network and 10 networks inferred from 20-, 30-, 40-, and 50-tree sets, respectively.


