
Figure 1.
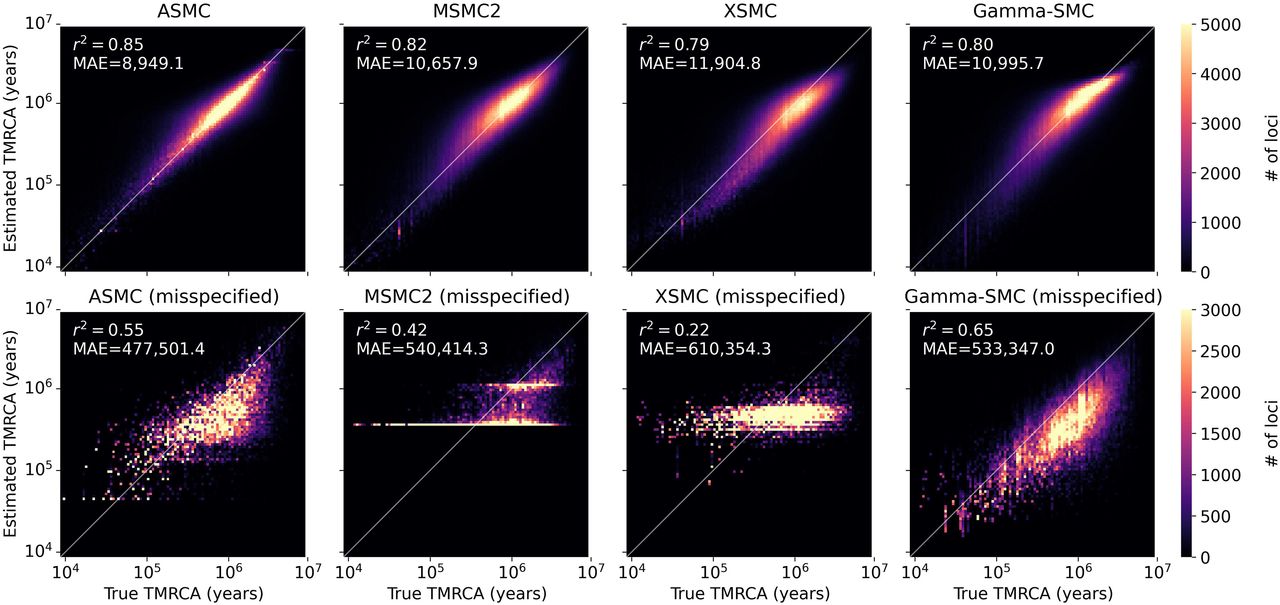
A comparison of the true TMRCA versus the estimated TMRCA (posterior mean) across a simulated genome. Shown for ASMC-seq, MSMC2, and XSMC versus Gamma-SMC when the correct population genetic parameters are given (top) and when parameter misspecification causes TMRCAs to be 100 times smaller than expected (bottom). Pearson's r2 and the mean absolute error (MAE; in generations) are shown.


