
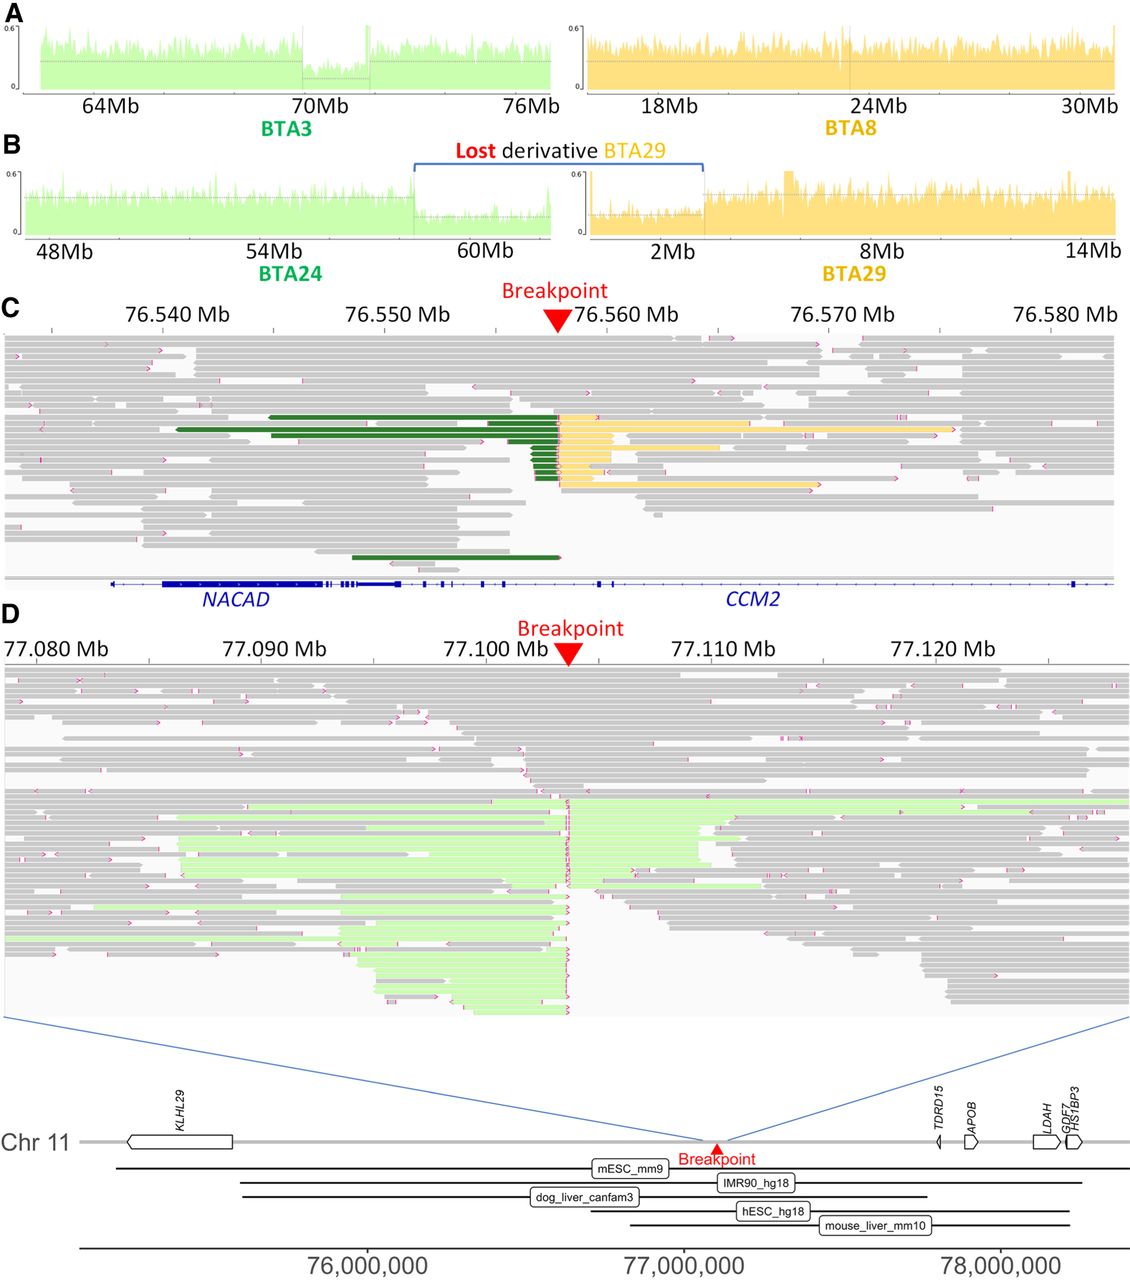
Contribution of PacBio CLR sequencing to the characterization of IR break points and fusion points. (A) Sequence coverage plots around the breakpoints of t(3;8) supporting a heterozygous deletion of ∼2 Mb on BTA3 of bull Ma. (B) Sequence coverage plots around the breakpoints of t(24;29),-der29 supporting a loss of the derivative chromosome of bull Ou. For vignettes A and B, control alignments are provided in Supplemental Figures S6I and S10I. (C) Read alignment around the second breakpoint of inv ins(8,4) at 76.6 Mb on BTA4 (bull Nt). Split reads that also map to BTA8 and to BTA4 around position 65.9 Mb are colored in green and yellow, respectively. Note that the breakpoint resulted in the disruption of CCM2. (D, top) Read alignment around the breakpoint of t(1;11) on BTA11 with split read aligning to BTA1 colored in light green (bull Ja). (D, bottom) Details of the genes and putative TADs (according to Wang et al. 2018) located around the breakpoint of t(1;11) on BTA11.


