
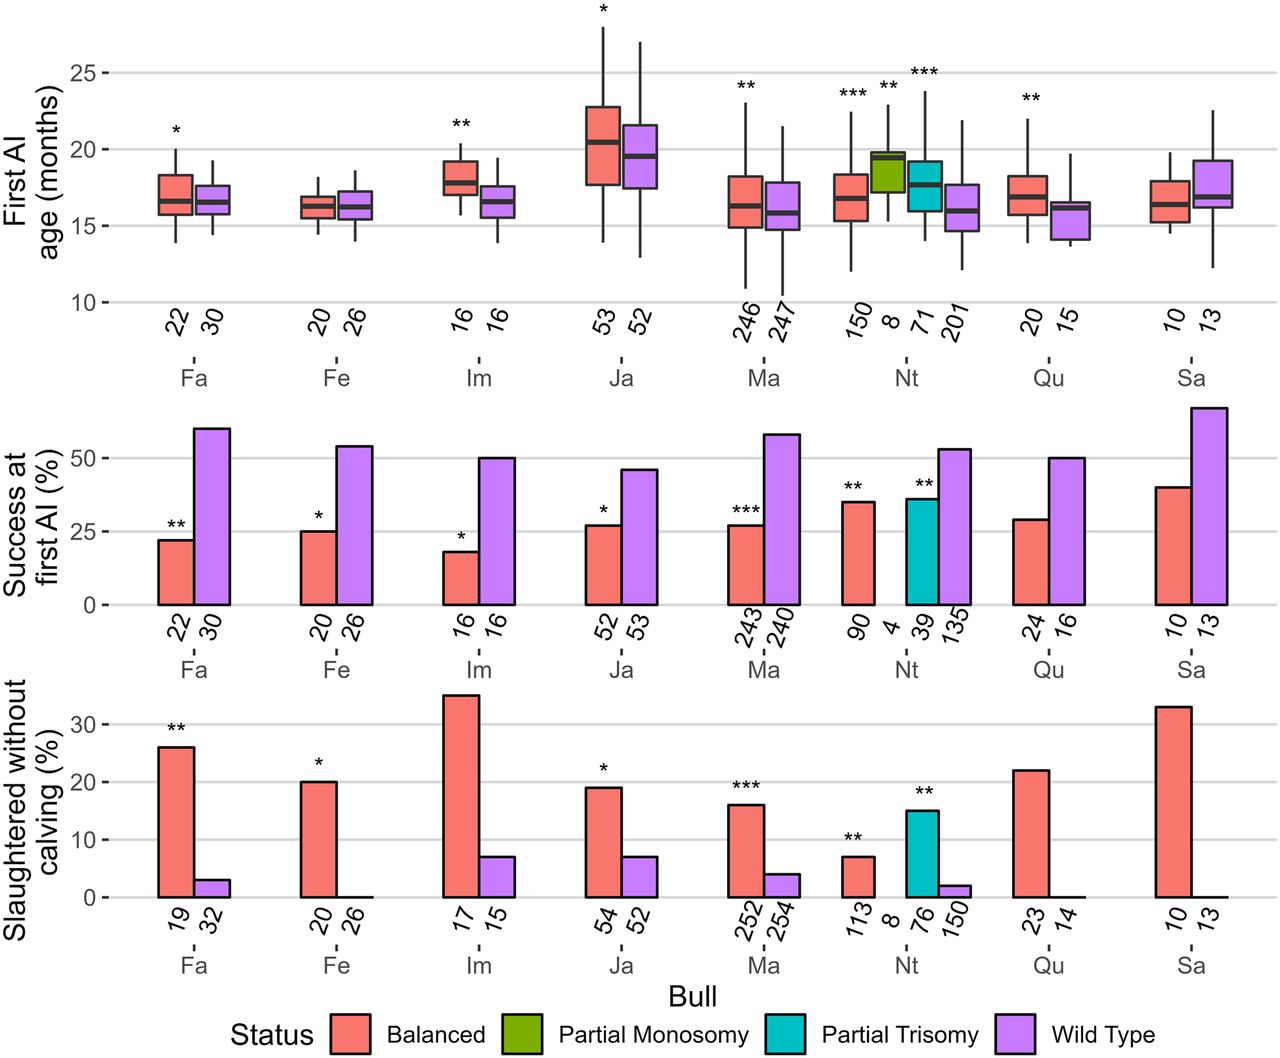
Figure 4.
Comparison of the performance of daughters with normal and abnormal karyotypes among the progeny of nine IR-affected bulls. Cohort sizes are given below each bar. Significance levels refer to comparisons with wild type groups. Student's t-test for first AI, Fisher's test for the other traits): (*) P < 0.1; (**) P < 0.05; (***) P < 0.01.


