
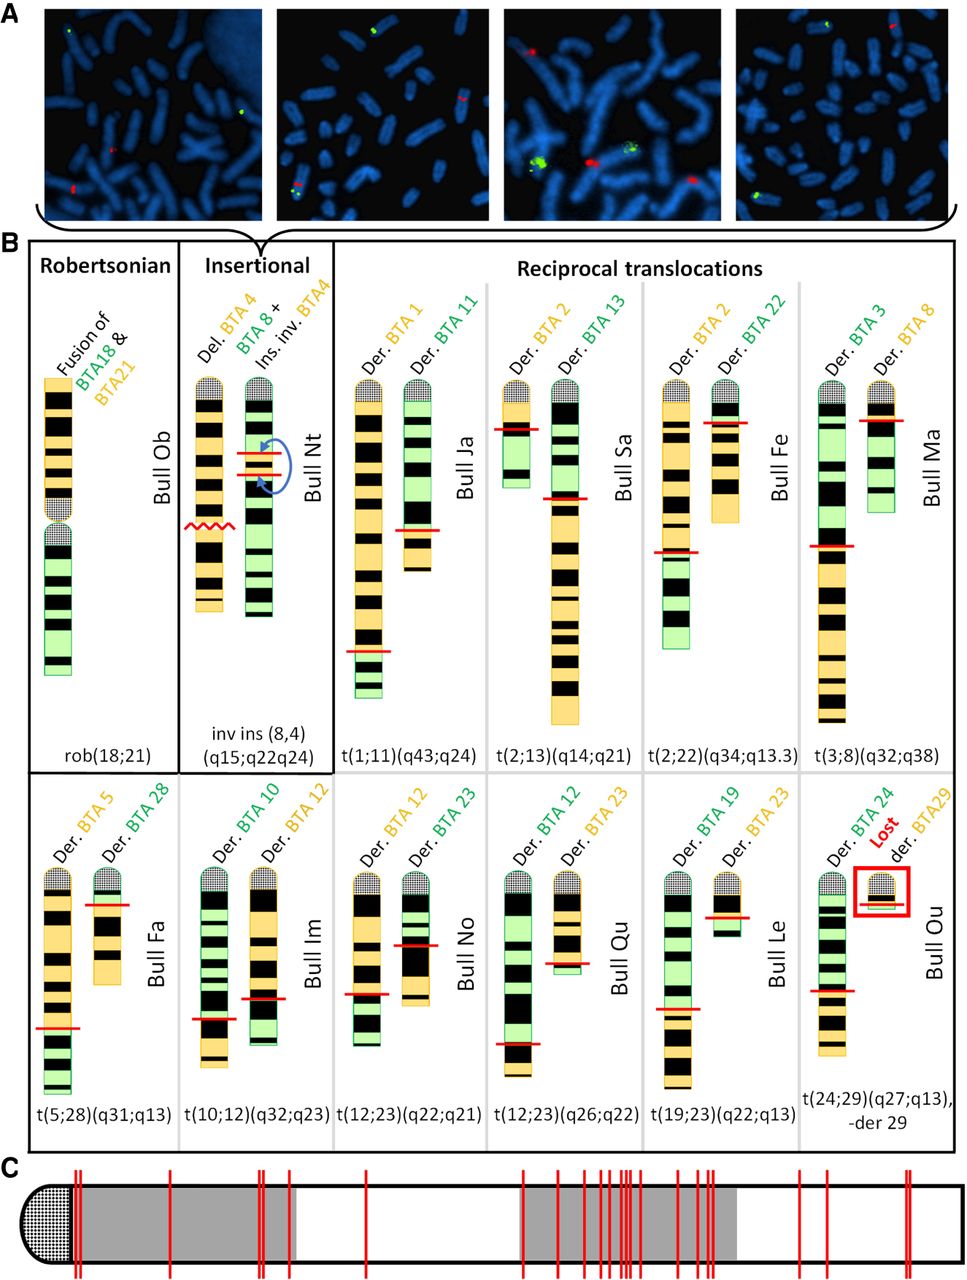
Validation of 12 IRs by cytogenetic analyses. (A) FISH mapping on cultured fibroblasts from four daughters of Nt with BAC clones located in the translocated segment from BTA4 (labeled in red) and in the centromeric region of BTA8 (labeled in green). From left to right, these animals show a normal karyotype, a balanced rearrangement, a partial BTA4 trisomy, and a partial BTA4 monosomy. (B) Schematic representation of the rearranged chromosomes based on GTG-banding karyotypes. Chromosomes with a loss or gain of material are shown in yellow and green, respectively. The schematics of the original chromosomes are available in Supplemental Figures S1D–S13D. (C) Location of the breakpoints on a theoretical chromosome. Coordinates are expressed as a percentage of chromosome length. Note the presence of 13 out of 24 breakpoints in the third quarter, whereas only six would be expected by chance.


