
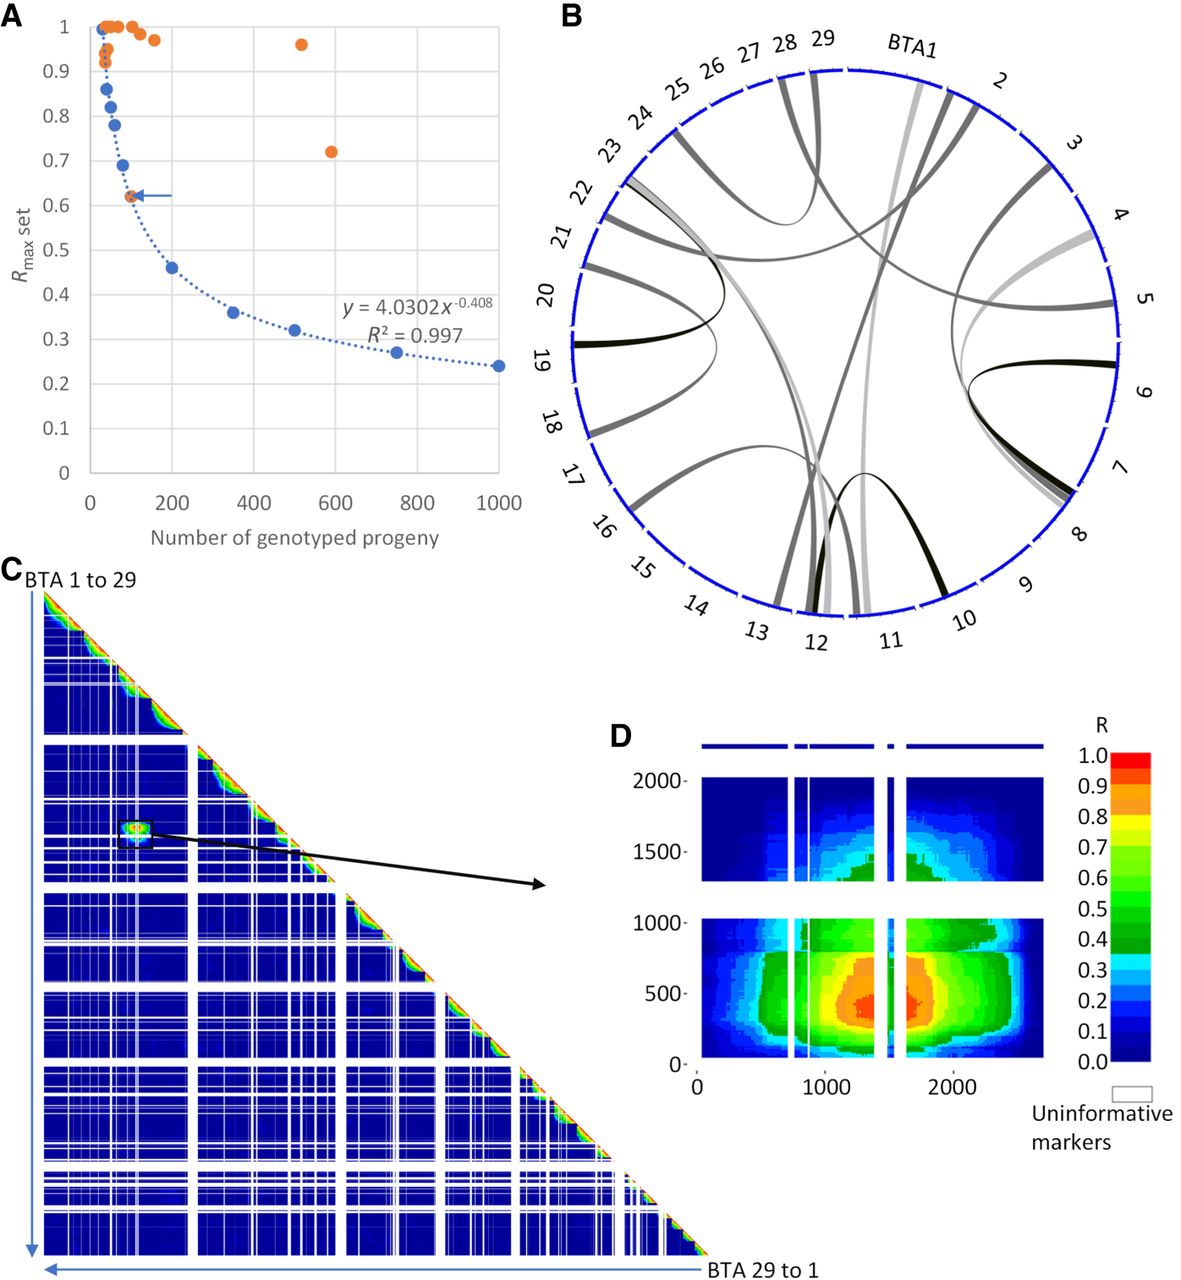
A novel approach to detect interchromosomal rearrangements (IRs) using SNP array genotypes in large half-sib families. (A) Regression curve of linkage disequilibrium (LD) significance thresholds (P = 0.001) obtained from series of 10,000 simulations. Blue dots indicate the results of simulations with 10 progeny group sizes ranging from 30 to 1000. Orange dots point to the maximal significant LD observed for 13 paternal half-sib families. (B) Circos plot (Yu et al. 2018; yimingyu.shinyapps.io/shinycircos/) representing the 13 rearrangements found. (C) Whole-genome LD map for a bull assumed to have an IR between BTA3 and BTA8. (D) Detail of the LD map between markers from these two chromosomes.


