
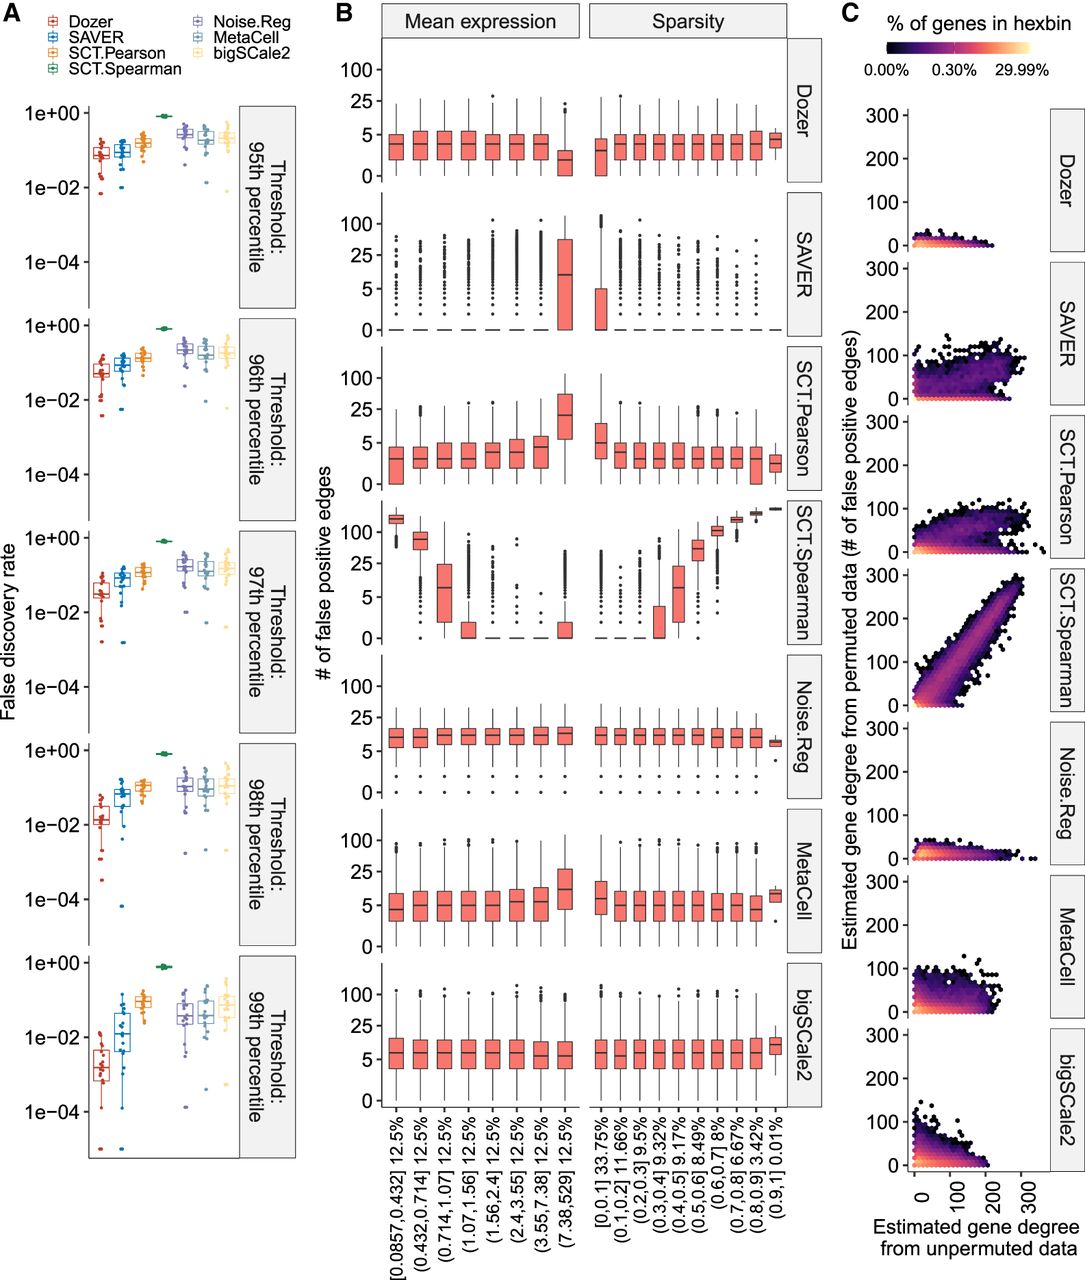
Impact of the overall expression and sparsity levels of genes on false-discovery rates of coexpression network edge detection. (A) Empirical false-discovery rates of the methods across multiple permutation experiments with the Jerber_2021 samples at multiple distinct thresholds set by the percentiles of the absolute values of the estimated correlations. The P-values from a one-sided Wilcoxon rank-sum test between Dozer and the second-best method, SAVER, for the five quantile thresholds are 0.077, 0.0014, 4.1 × 10⁻⁵, 9.5 × 10⁻⁶, and 0.00016, respectively. (B) Numbers of false-positive edges of genes stratified by mean expression levels and the proportion of zeros in gene counts (sparsity). Percentages on the x-axis denote the percentage of genes in the expression and sparsity intervals. (C) Estimated gene degrees (i.e., numbers of edges connected to a gene) from the coexpression network with the permuted (y-axis) versus unpermuted (x-axis) data. Coexpression networks are constructed between the two groups of genes that result from splitting of the genes. Gene degrees are estimated from coexpression networks with the original data (unpermuted; x-axis) and data in which cells are permuted for one set of the genes (permuted; y-axis). Because the correlation of genes in the permuted data is zero, the corresponding gene degrees are contributed by falsely detected edges, highlighting the aggregated impact of mean expression levels and proportion of zeros in deriving the genes’ overall associations. Results are pooled from multiple permutation replicates across the genes.


