
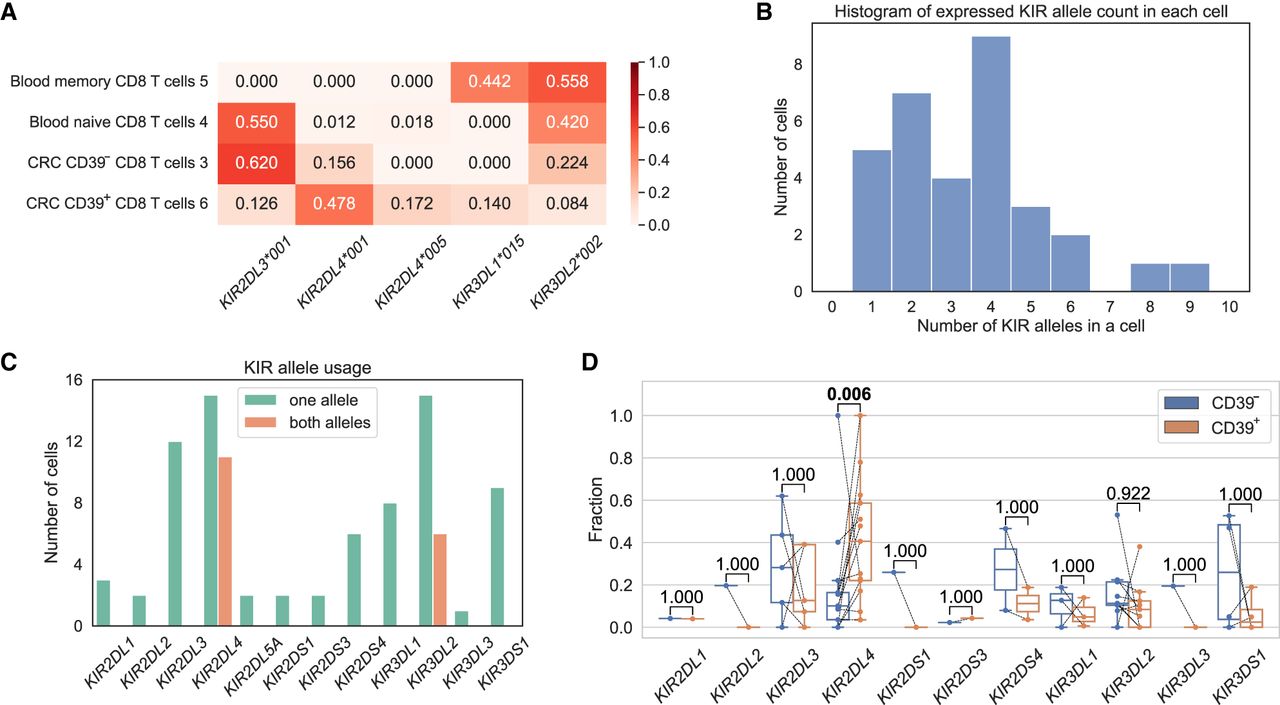
Figure 2.
KIR alleles in CD8+ T cells. (A) KIR allele expression fractions in four cells from a colorectal cancer (CRC) patient. (B) The number of expressed KIR alleles in a cell. For example, seven cells expressed two KIR alleles. (C) The number of cells that express the KIR gene, splitting by the cases of single-allele expression or both-allele expression. Only detected KIR genes are displayed. (D) Comparison of the KIR allele fractions between CD39− CD8+ T cells and CD39+ CD8+ T cells. Each line connects a KIR allele in the CD39− cell and the CD39+ T cell from the same patient. The P-values are computed with a Wilcoxon signed-rank test and have been adjusted by the Benjamini–Hochberg procedure.


