
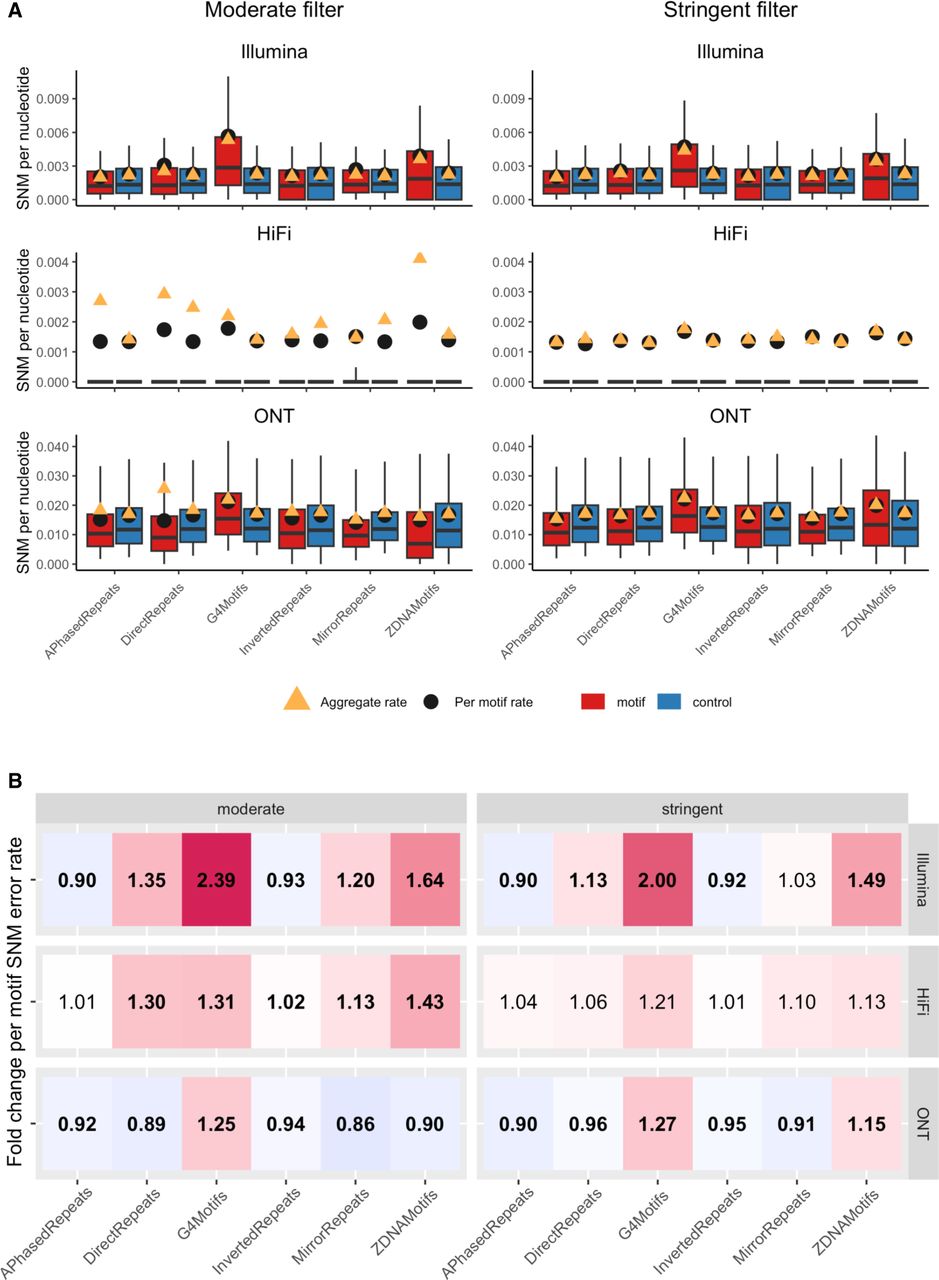
Single-nucleotide mismatch (SNM) error rates in non-B motifs. (A) Boxplots of per-motif SNM error rates. Boxplot whiskers show the fifth and the 90th percentiles, and values outside whiskers are excluded from the boxplots in order to better visualize the bulk of the distributions. The left panel shows the moderately filtered motif set; the right panel, the stringently filtered set. The three rows correspond to the different technologies (Illumina, HiFi, and ONT). Red and blue boxes correspond to motifs and controls, respectively; black dots mark per-motif means; and orange triangles aggregate error rates (sum of all errors divided by sum of all aligned nucleotides). Note that the y-axes differ among technologies. (B) Heat maps visualizing fold changes in per-motif means of SNM error rates between motifs and corresponding controls. Red (blue) shades indicate higher (lower) error rates in non-B motifs than in the controls, with fold change values reported in each cell of the map. When these values are in bold, per-motif means were significantly different between motifs and controls (t-test P-values corrected for multiple testing smaller or equal to 0.05). Also, here, left and right panels correspond to moderately and stringently filtered sets, respectively, and rows correspond to Illumina, HiFi, and ONT technologies, respectively.


