
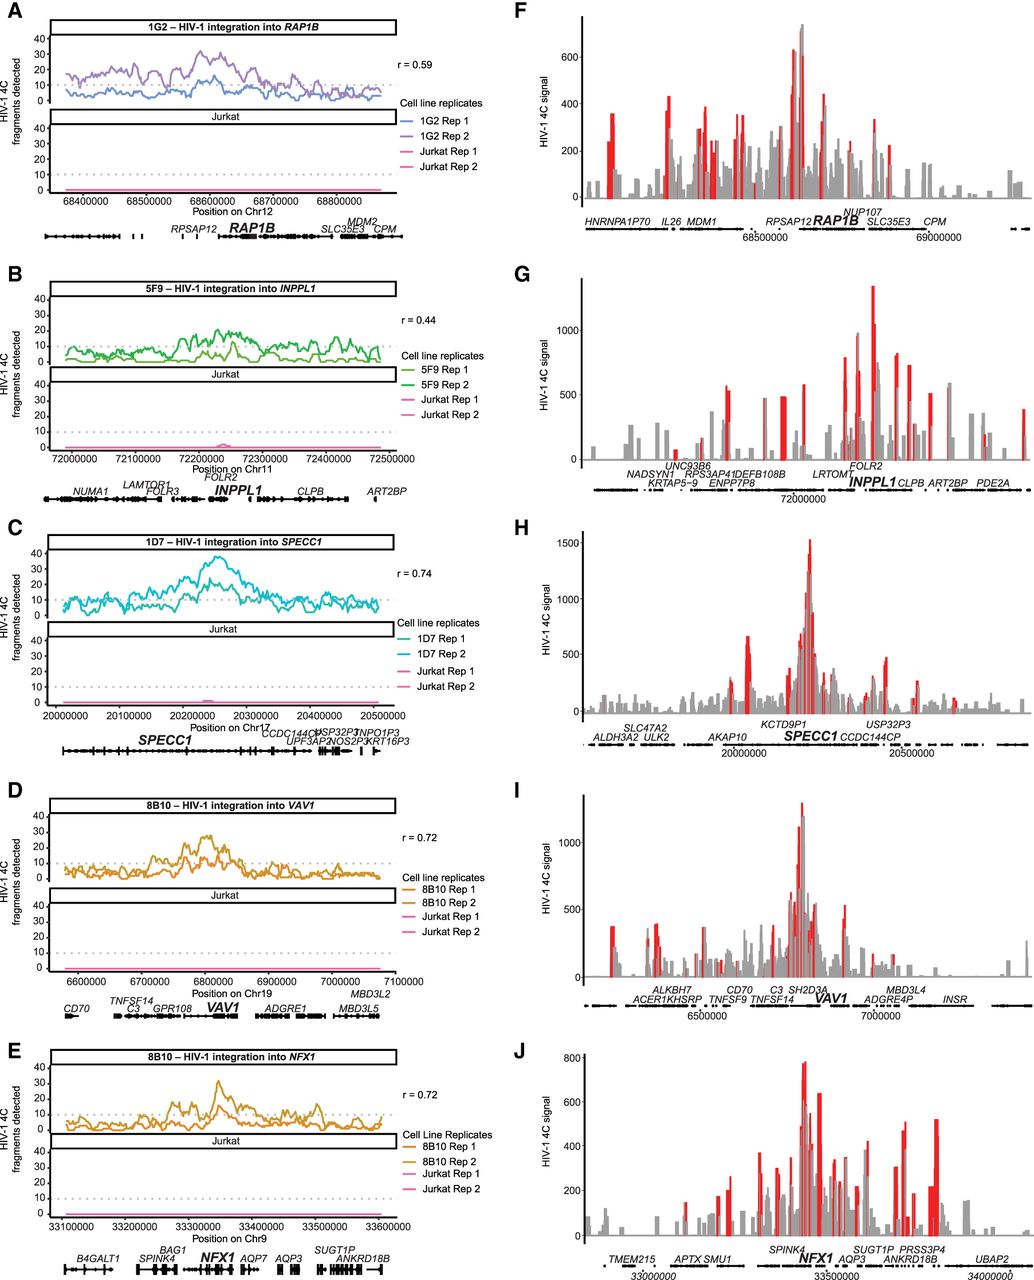
HIV-1–host chromatin interactions captured by HIV-1 4C-seq. (A–E) Genomic tracks of the number of fragments detected (captured with at least 10 reads) in a running 40-fragment window, which was slid five fragments at a time. Shown is a 500-kb window centered on the integration site. Signals in Jurkat 4C-seq libraries were shown for comparison. Pearson correlation coefficient between experimental replicates is indicated. Dotted line indicates 10 fragments, the threshold chosen for overlapping with ATAC-seq peaks. (F–J) Genomic tracks of the read normalized signal as calculated by peakC in a 21-fragment sliding window in a 1-Mb region centered on the integration site. Red regions indicate P < 0.05 relative to distance-based model.


