
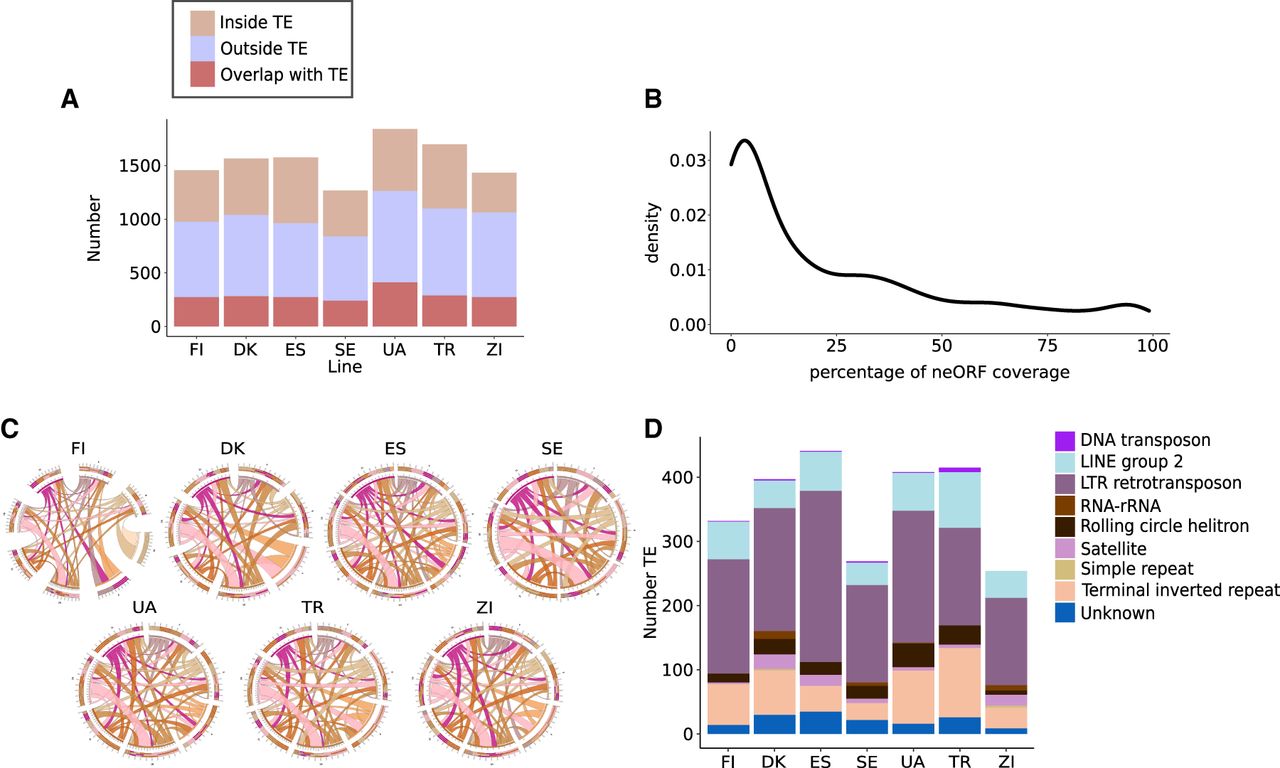
neORFs and transposable elements. (A) Overlap between neORFs and transposable elements inside lines. The x-axis represents the lines and the y-axis represents the number of neORFs. A brown color represents neORFs that are located inside of a transposable element; the violet color represents neORFs that do not overlap with a transposable elements; the pink color represents neORFs overlapping partially with a transposable element, but not entirely. (B) Percentage of the neORF covered by a TE for neORFs from the category “Overlap with a TE.” (C) Circle plots representing the genomic location of neORFs duplicated inside a line's genome. A circle's borders represent chromosomes. The circle plots were created using Circos (Krzywinski et al. 2009). (D) TE families of TEs overlapping with neORF that are duplicated.


