
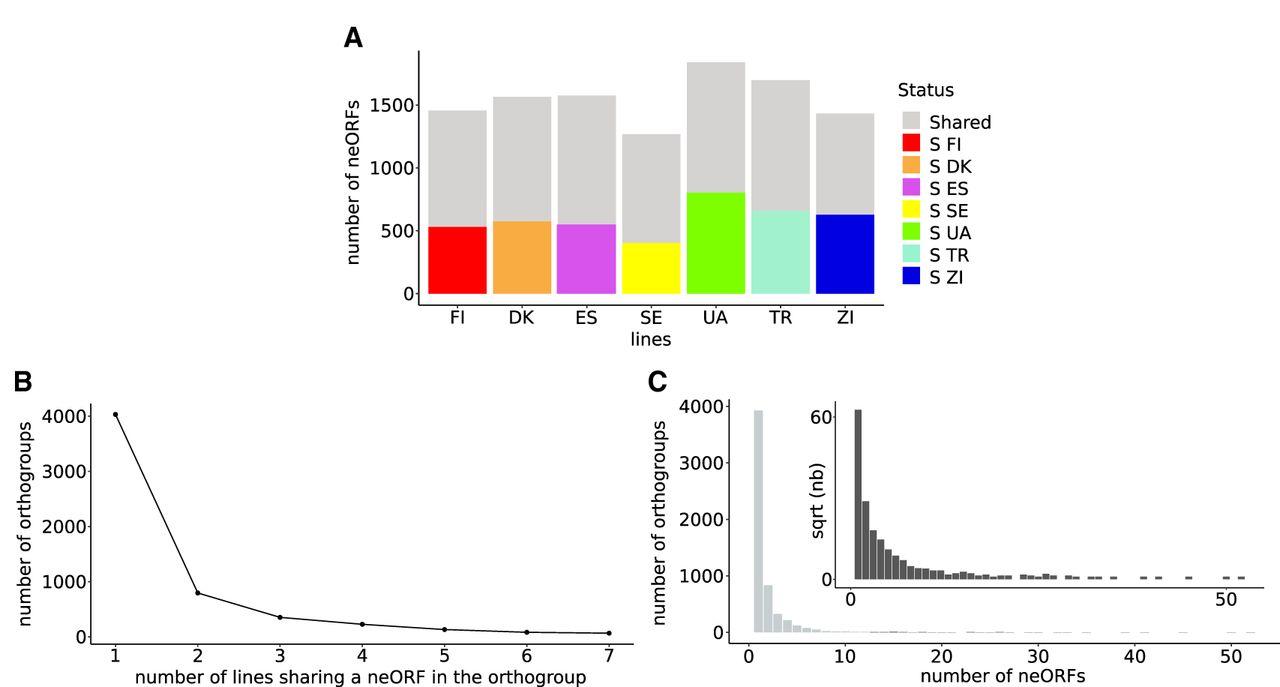
Figure 2.
Characteristics of orthogroups from the seven lines of D. melanogaster. (A) Number of neORFs per each line. Colors represent neORFs that are specific to their line. Gray denotes neORFs with orthologs in other lines. (B) Number of orthogroups found in one line or shared by several lines. The x-axis represents the number of lines sharing a neORF in an orthogroup. The y-axis represents the number of orthogroups. (C) Number of neORFs per orthogroup. The x-axis represents the number of neORFs presents in an orthogroup, the y-axis represents the number of orthogroups corresponding to these numbers.


