
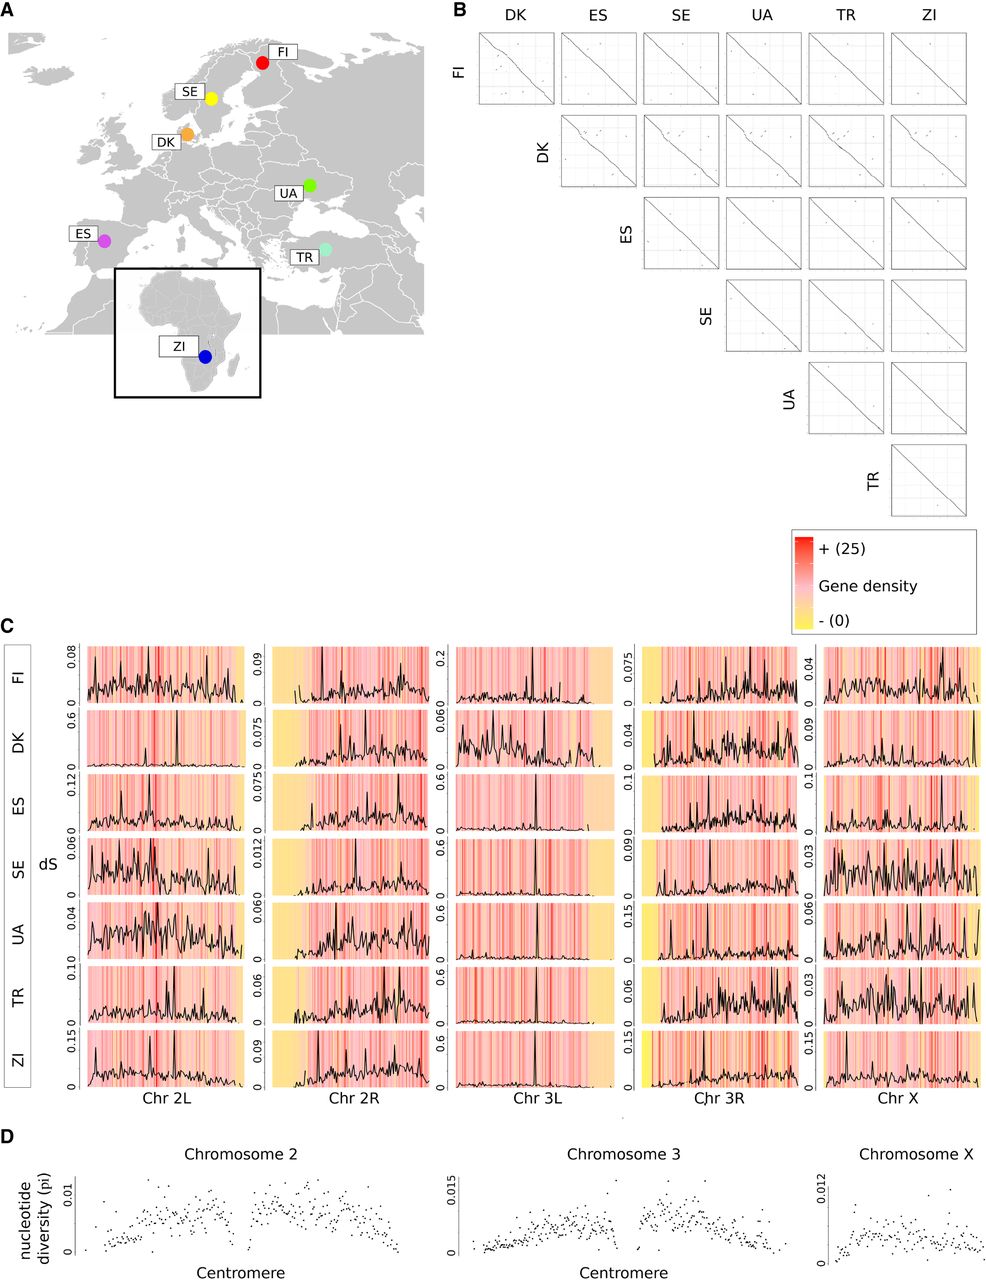
Genome alignments and gene contents. (A) Geographic origins of lines; (B) dot plots of all pairwise genome alignments; (C) gene density and dS values of genes in genomes of each line. The five major chromosome arms are shown for each line. The colors represent the density of established genes in successive genomic intervals of 160,000 bp. Red denotes highest density; yellow, lowest density. Black lines represent average dS values of established genes located in the respective interval. dS was calculated by aligning genes from all lines to orthologs from the reference genomes (see Methods section). (D) Average gene polymorphism in Chromosomes 2, 3, and X. The dots represent the nucleotide diversity π of established genes in successive genomic intervals of 160,000 bp.


