
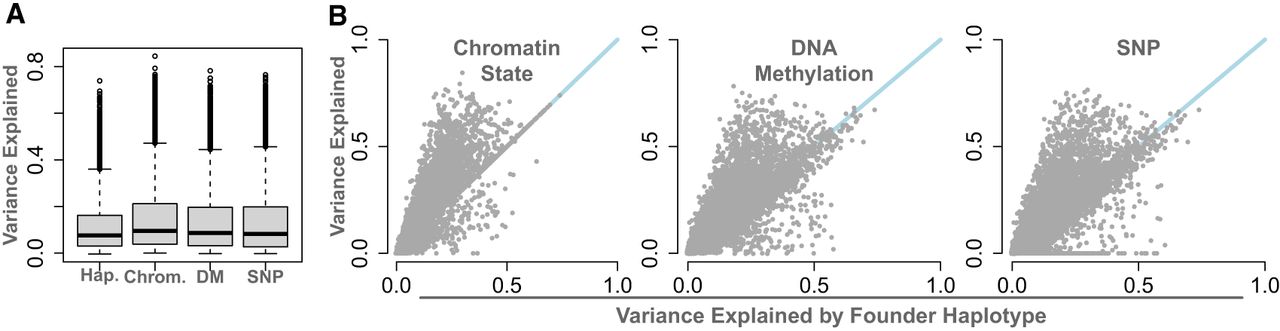
Figure 7.
Comparison of the variance explained in DO gene expression by four genomic features: haplotype (Hap.), chromatin state (Chrom.), local SNP genotype (SNP), and local imputed DNA methylation status (DM). (A) Distributions of gene expression variance explained by each feature. (B) Direct comparisons of variance explained by local haplotype and each of the other genomic features. Blue lines show y = x. Each point is a single transcript.


