
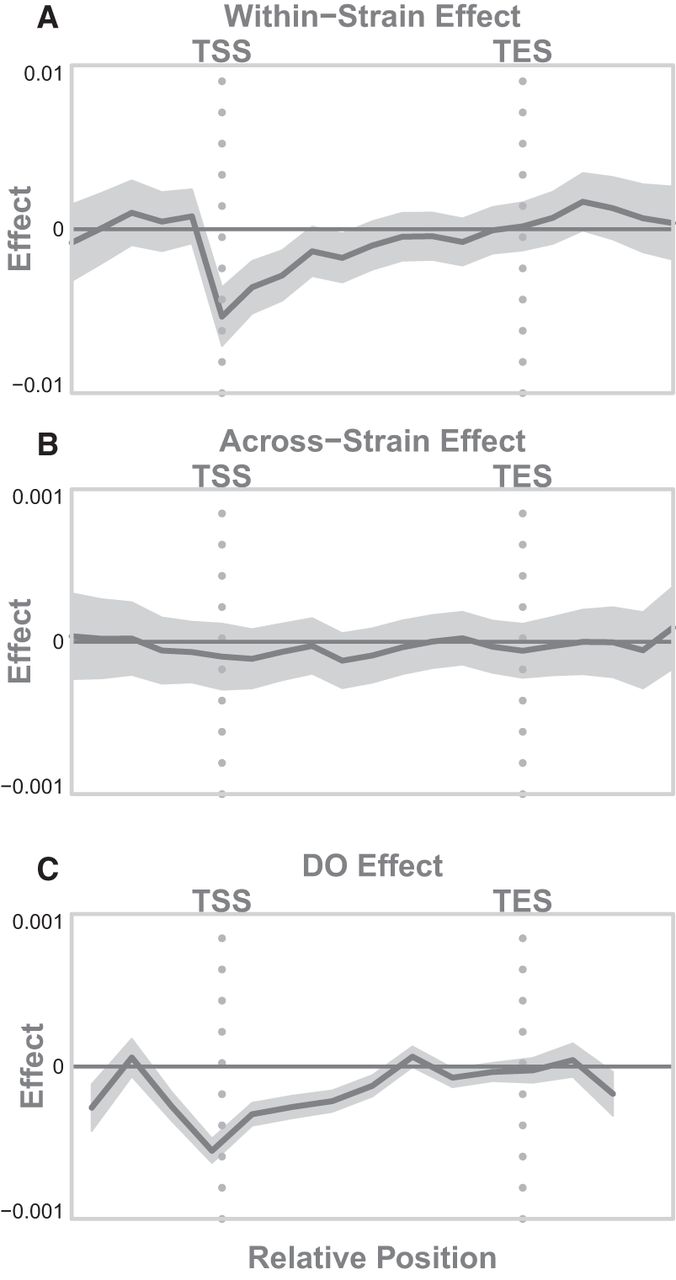
Figure 6.
Association of DNA methylation with gene expression (A) across genes in hepatocytes, (B) across inbred strains, and (C) in the DO population. The dark gray line shows the estimated effect of percentage of DNA methylation on gene expression. The x-axis is normalized position along the gene body running from the TSS to the TES, marked with vertical gray dotted lines. The horizontal solid black line indicates an association of zero. The shaded gray area shows a 95% confidence interval around the model fit.


