
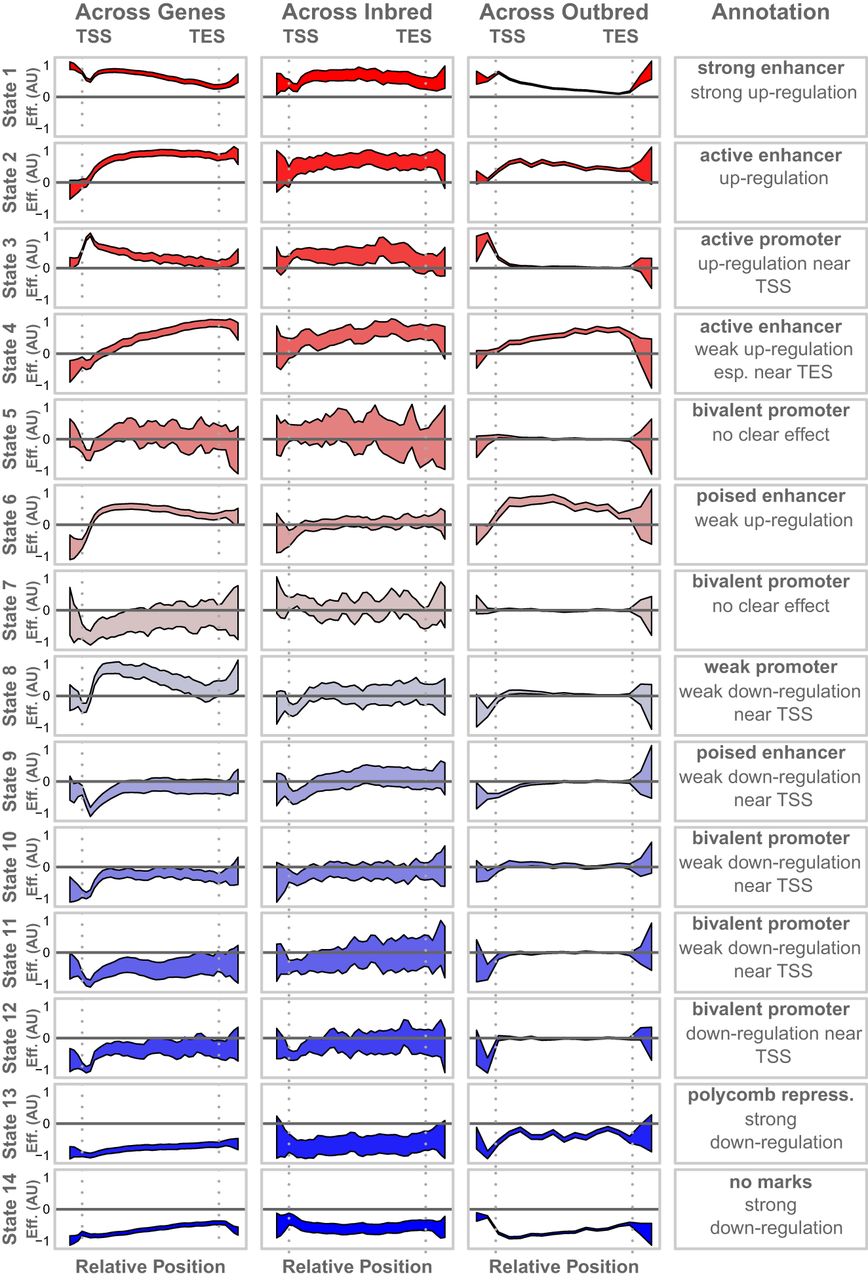
Associations of chromatin states with gene expression. Each column shows the association of each chromatin state with gene expression in a different experimental context as labeled. Effects shown are β coefficients from Equation 1. The y-axes vary across each row to emphasize the shape of each effect, so y-axis labels indicate only positive and negative effects. Colored areas show the 95% confidence interval around each estimate. The final column shows the annotation of each state for comparison with its association with gene expression. All x-axes show the relative position along the gene body, running from just upstream of the TSS to just downstream from the TES. Vertical gray dotted lines mark the TSS and TES in all panels.


